Visualizing the Final Foursome

A Power Rankings-style guide to the Final Four, heavy on turnovers, unibrows and line charts:
Ohio State: Turnometer Gone Wild
How many players can say their best performance of the season was in the NCAA tournament? That's the case for Buckeyes pest/point guard Aaron Craft, who had the Turnometer™ needle buried by creating 10 turnovers against Cincinnati in the Sweet 16. According to SI's charting, it was Craft's top turnover-creation game of the season, beating his previous best of 9.5 against Jackson State on Nov. 18. The Turnometer has been updated and enhanced:
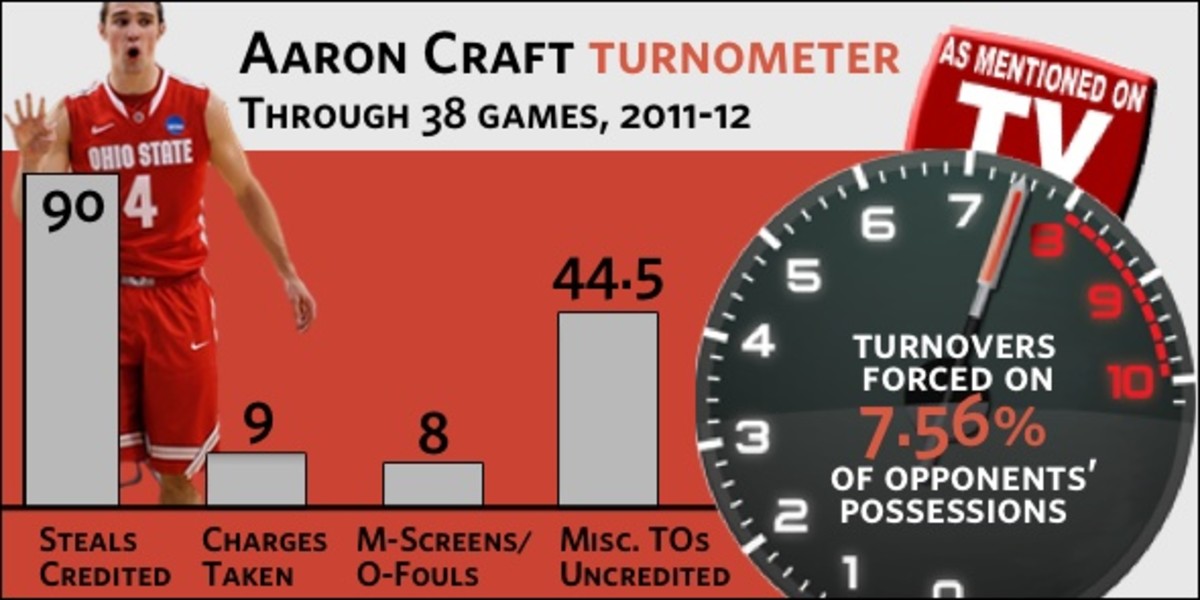
(In NCAA tournament games only, Craft is creating turnovers on 8.10 percent of opponents' possessions.)
I would not advise that Kansas' Tyshawn Taylor, whom Craft will guard on Saturday, watch the following compilation of Craft's 10 turnovers-forced against the Bearcats. (His TO rate: 15.08 percent!) But you should most definitely watch it.
[wpvideo qXFGupCA w=590]
This is my current favorite CraftFact: In the NCAA tournament, he's accounted for 40.20 percent of Ohio State's total turnover production. That includes 13 credited steals, 5.5 uncredited turnovers, one charge taken and one moving-screen foul drawn.
Kansas: Tyshawn and Turnovers
Tyshawn Taylor was having a miserable NCAA tournament until his 22-point, five-assist, five-steal outing against North Carolina in the Elite Eight. Has he turned a corner, or should we be worried, given the impending Craft matchup, that Taylor is one of the two Final Four point guards who commits turnovers of more than six percent of his team's possessions? This handy info graphic breaks it down:
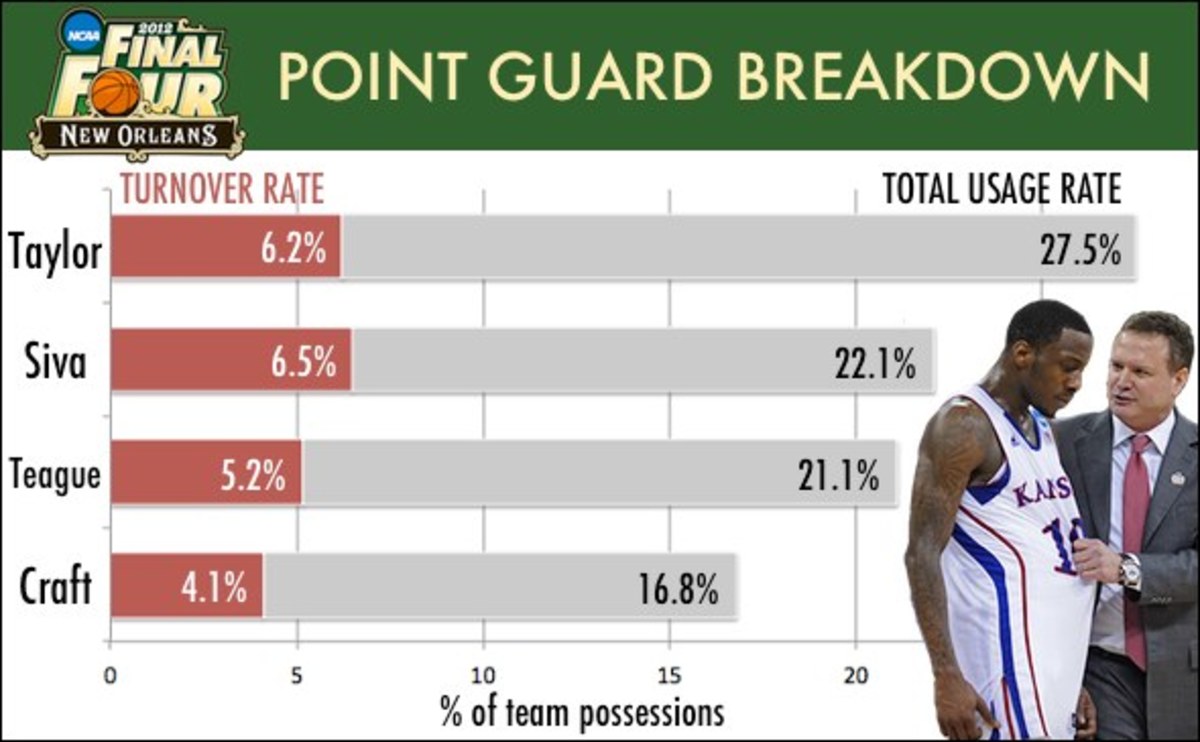
In Taylor's defense, he also uses more total possessions (27.5 percent) than any other Final Four point guard, because he and Thomas Robinson are counted on to co-carry Kansas' offense. A player who needs to create his own points will naturally commit more turnovers than a conservative, pass-first point guard ... but still, you've seen Taylor play: He's liable to take ill-advised shots when he's rushed or flustered. Craft will rush and fluster him. Can Taylor stay cool in the biggest game of his career?
Kentucky: The Many Faces of Anthony Davis
Anthony Davis is the most efficient offensive player on the best offense left in the NCAA tournament (and the second-best offense in the nation, after Missouri's). According to SI's charting, Davis has 47 offensive possessions in the NCAA tournament, and he's averaging 1.191 PPP, down from his season-long figure of 1.358. His ability to alter his offensive identity from game-to-game, though, has only gotten better.
The ways Davis tries to score in the tourney have varied widely. Against Baylor in the Elite Eight, Davis had 13 possessions and was heavy on spot-up jumpers (four) and lobs (four). He posted up just once.
He was limited to seven possessions against Indiana, and the Hoosiers prevented him from any lob attempts. In that game, he was primarily a putbacks (two) and pick-and-pops (two) guy. Davis had 15 possessions against Iowa State, the majority coming on pick-and-pops (four), spot-ups (three) and isolations (three).
But against Western Kentucky in the opening round, he had 12 possessions and was primarily a back-to-the-basket post player (six).
The color-coded grid below shows how much Davis' offensive attack differed between the Wildcats' first NCAA tournament game and their most recent one*. He went from heavily red to yellow and green. Possessions appear from left to right in order of occurrence, and if points were scored on a possession, they're indicated in the white boxes.
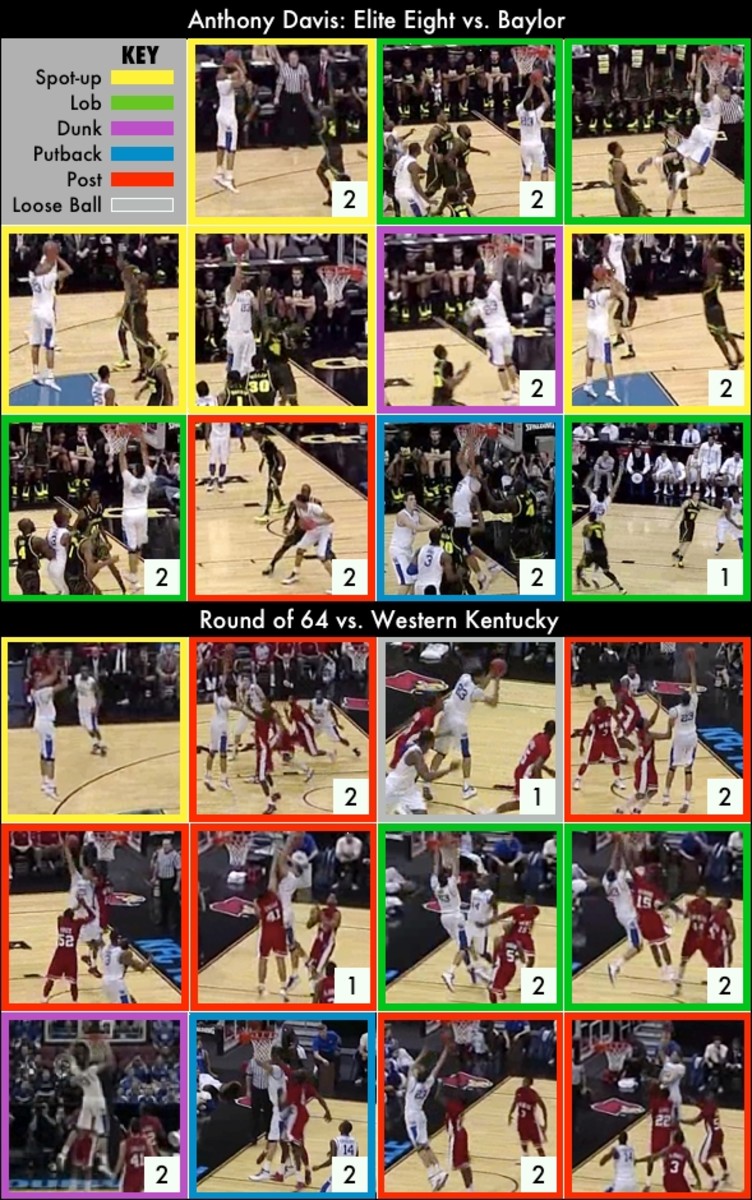
(* Against Baylor, Davis had three additional points on free throws off of loose-ball fouls, which are not shown here.)
Louisville: The Lock-Down Crew
Final Four fact: Louisville's defense is better than Kentucky's defense. If you hear someone claim the inverse of this -- say, a Kentucky fan who's eight hurricanes deep at 2 a.m. on Bourbon Street -- feel free to approach him and make a correction. Hand him a kenpom.com printout showing the Cardinals ranked No. 1 in defensive efficiency. I'm sure the exchange will be cordial. No one wants to be misinformed.
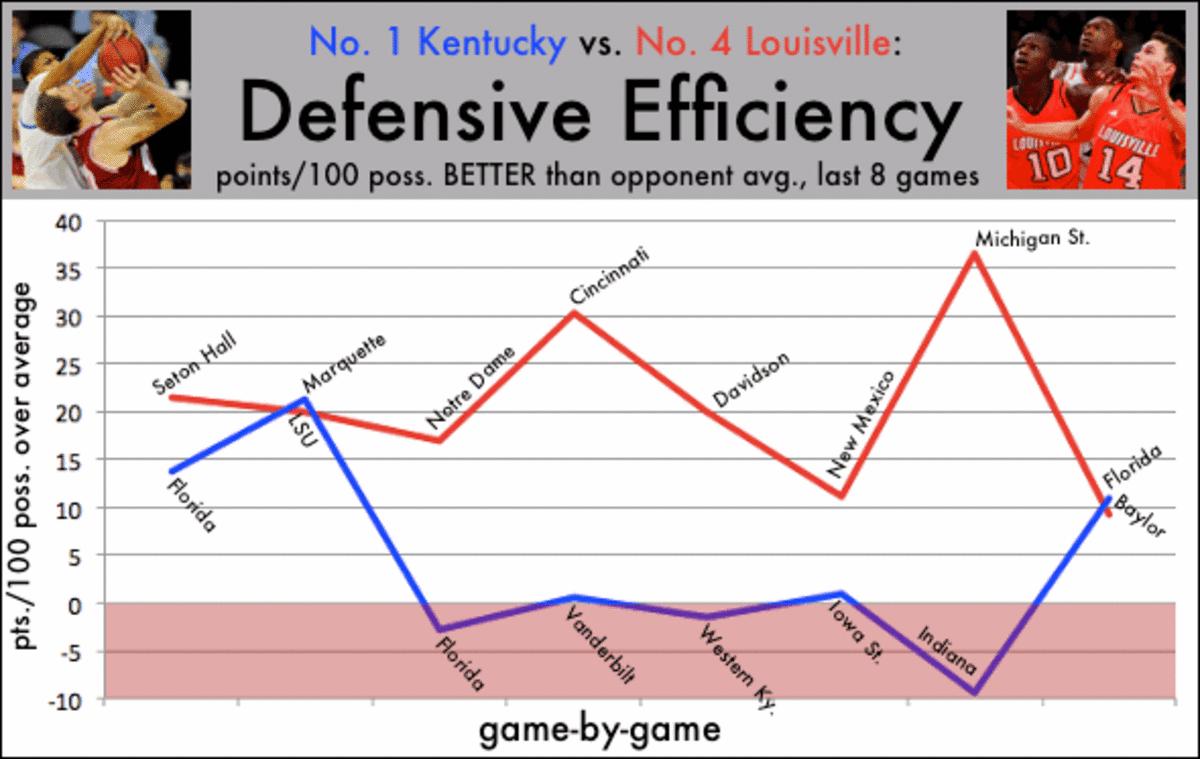
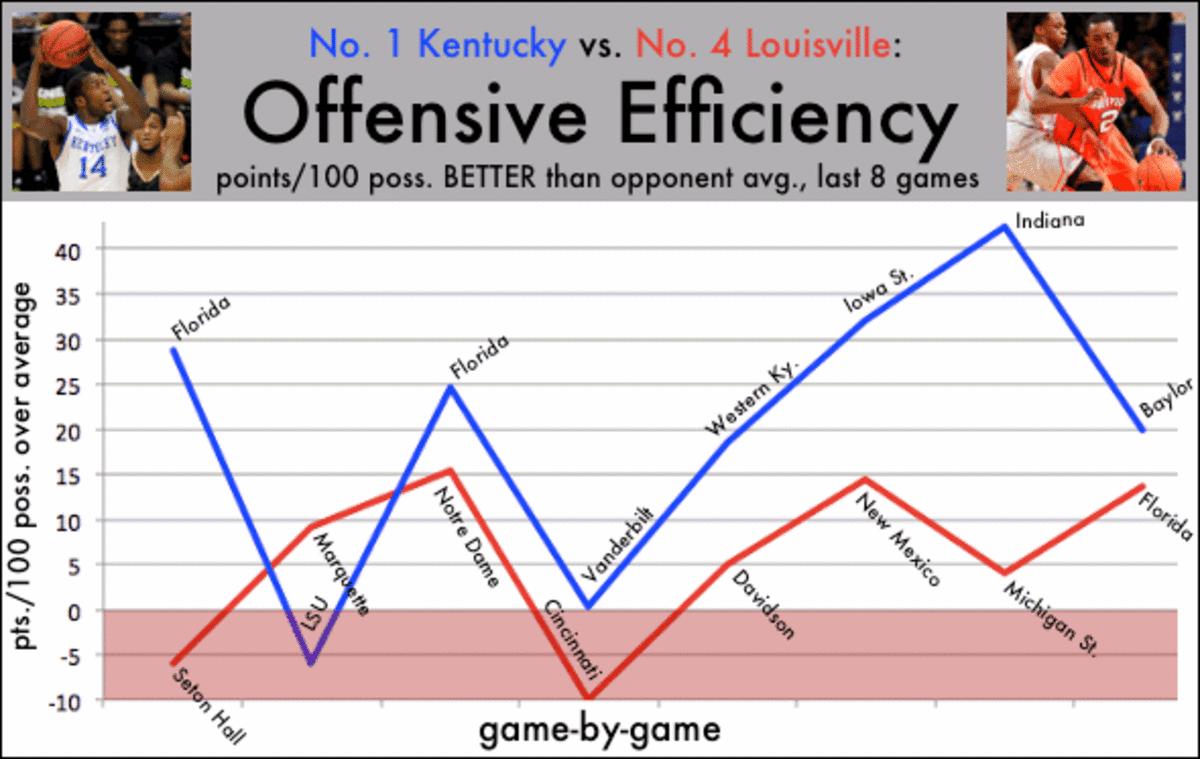
The chart below compares the defensive performances of Louisville and Kentucky, over the past eight games, to their opponents' average offensive performance, and maps out the margin. The Cardinals' D has been between 10 and 37 points per 100 possessions better than average, and was almost off the charts against Michigan State in the Sweet 16. Kentucky's defense was above average vs. Baylor in the Elite Eight -- about just as good as Louisville's was against Florida -- but for the rest of the NCAA tournament, the Wildcats' D has been either at or below average.
It should be noted, though, that Kentucky's offense is in a different stratosphere than Louisville's. Against Indiana, UK was 40-plus points per 100 possessions better than average, and it has been excelling on the whole in the NCAAs. Louisville's offense hasn't been in the red yet in the NCAAs, but it's not at Kentucky's level.
