College Football Gameday Safety

When it comes to tailgating, college football does it best. Every Saturday throughout the season, alums, students and other fans gather together on college campuses to support team traditions, show off school pride and attend all-day affairs filled with food, drinks and music. Tailgating on gameday—and the culture surrounding it—is deeply-rooted into institutions all across the country.
But as thousands fill college towns for gameday each weekend, the sudden spike in local traffic, alcohol consumption and overall mayhem creates a weekly challenge for campus law enforcement.
Sports Illustrated compiled campus police records from 33 of the biggest football schools in the country to determine the number and type of incidents that occurred across campus during each gameday of the 2017 season. The results, shown below in ascending order of incident rate (the number of incidents per thousand fans each gameday, defined further below), are an illustration of college football gameday misconduct and provide a look into the safety of campuses during tailgate season across the country.
The average total number of police incidents on campus on gamedays was 139.4 incidents. Alabama led the group of schools with the most total number of police incidents on campus on gamedays with 448, while N.C. State reported the highest incident rate among the schools.
Typically, a higher number of reported incidents was correlated with a stricter policy on underage alcohol enforcement and the schools with the highest incident rates reported hundreds of alcohol-related incidents. Universities on the opposite end of the spectrum—those reporting 50 incidents or less over the season—reported markedly lower numbers of alcohol offenses. For example, underage drinking offenses made up only 17% of total offenses at Arkansas, one of the schools with the least reported incidents on gamedays last year.
Definitions
Incident rate: The number of incidents per thousand fans each gameday. This was calculated by multiplying the average number of incidents on campus per gameday by 1,000, and dividing that number by average attendance.
For example, Florida State reported a total number of 95 incidents over six gamedays last season, which is an average of 15.8 incidents per gameday. Florida State's average game attendance is 70,943. The school’s incident rate is calculated as 0.223, which is lower than UCF’s incident rate of 0.402, which reported a total of 89 incidents and an average of 14.83 incidents per gameday, but averaged approximately 34,000 fewer fans per game.
Time frame: Data sourced from 2017 campus police logs and the 2017-18 college football season schedules. Hours were set from late morning (after 10 a.m.) on the day of the game, to early morning (4 a.m.) the next day. This timeframe was set to include any campus activity in the hours before and after the kickoff time on gameday. Any campus incidents reported during this time were included in our report. The average number of incidents per season was 139.
Incident categories + key
Alcohol: minor-in-possession, fake ID, public intoxication, DUI and other alcohol-related incidents. For example, some schools would list these incidents as "alcohol violations" or "drunkenness”
Drugs: drug possession, paraphernalia possession, intent to sell
Theft: any incident labeled as theft, larceny or burglary
Property: vandalism, breaking and entering, damaged property. Some schools listed this as "property crime."
Disturbance/disorderly: Including shut down parties, loud and reckless, disturbing the peace, fraud (selling of fake gear), harassment
Violence: assault, any weapons-related charges, sexual assault, rape, fights, battery
Traffic/vehicle: speeding, traffic crashes, parking offenses. Some schools listed as "traffic" or "vehicle incident" on their reports.
Medical: Sick or injured person, mental health calls (suicide threats, Marshall Act), welfare checks for incidents not linked to alcohol
Warrant: arrests made on warrant
Questions
How was this data compiled? Due to the Clery Act, schools are required to publish a daily police log of all occurrences on campus. Sports Illustrated obtained these records online or directly from university police departments, then pulled data for each gameday (as defined by the time frame above).
What patterns emerged from week to week? Most schools saw the same pattern each season: incidents peaked in the first two or three games, then slowly tapered off, with the exception of a spike on the day of a rivalry game or major upset. According to officials at these universities, incidents typically peak at the start of the season for several reasons.
A team’s home opener is typically one of the most highly attended games of the season, and after the long drought of the offseason, fans are often both exuberant and unprepared, which can result in over imbibing and rowdy behavior. Additionally, these games take place during the hottest weather of the season, which causes a spike in need for medical assistance, particularly in schools in the south where temperatures can top out in the upper 90s in September.
To combat these two issues, campus police departments typically create a stronger enforcement plan for incident-prone gamedays. This means that police often intervene at a higher rate at the start of the season and during rivalry gamedays in order to prevent escalation and ensure that drunk fans don’t enter the stadium.
Should fans be concerned if their school has a higher incident rate? Not necessarily. However, if your school reports a higher incident rate, it might be a sign to be more careful about how you consume alcohol this season.
A higher number of reported incidents was typically correlated with a stricter policy on underage alcohol enforcement. The schools that reported the highest rates reported hundreds of alcohol related arrests. Texas A&M, for instance, made nearly 200 minor-in-possession arrests last season.
Other schools are less punitive on underage drinking and other alcohol offenses. The University of Nebraska, for instance, partners with a local non-profit called The Bridge to provide care to over-intoxicated fans. When officers transport fans to the Bridge, they are not cited; instead, the organization notes where the patient received alcohol to collect data for the police. This can explain why Nebraska has one of the top five lowest incident rates out of all 33 schools.
How do students fit into all of this? The main incident linked to students is widespread underage drinking on gamedays. The vast majority of college football fans, however, aren’t students. Alumni, families and locals typically account for over 70% of attendance, especially at programs with major fan support from their local communities, such as South Carolina and Nebraska. Gameday safety policies accordingly have to be written and enforced with the entire fanbase in mind.
Oklahoma
Incident rate: 0.05
Conference: Big 12
Undergraduate student body (2017): 21,844
Average game attendance (2017): 86,520
Location type: City
Number of home games: 6
Total number of police incidents on campus on gamedays: 26
Number incidents per gameday: 4.33
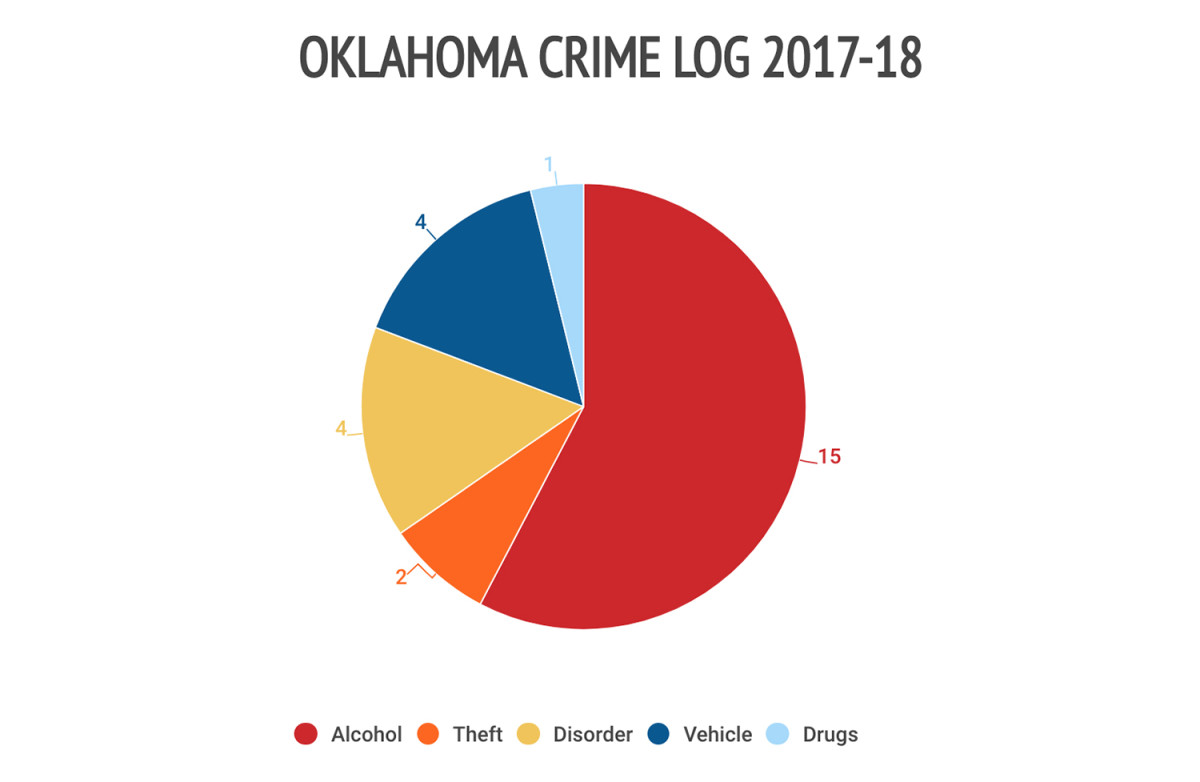
Over six home games, campus police reported 15 alcohol-related incidents, four disorderly incidents, four vehicle-related incidents, two thefts and one drug-related incident.
Florida
Incident rate: 0.07
Conference: SEC
Undergraduate student body (2017): 34,554
Average game attendance (2017): 86,715
Location type: Suburban
Number of home games: 7
Total number of police incidents on campus on gamedays: 44
Number incidents per gameday: 6.3
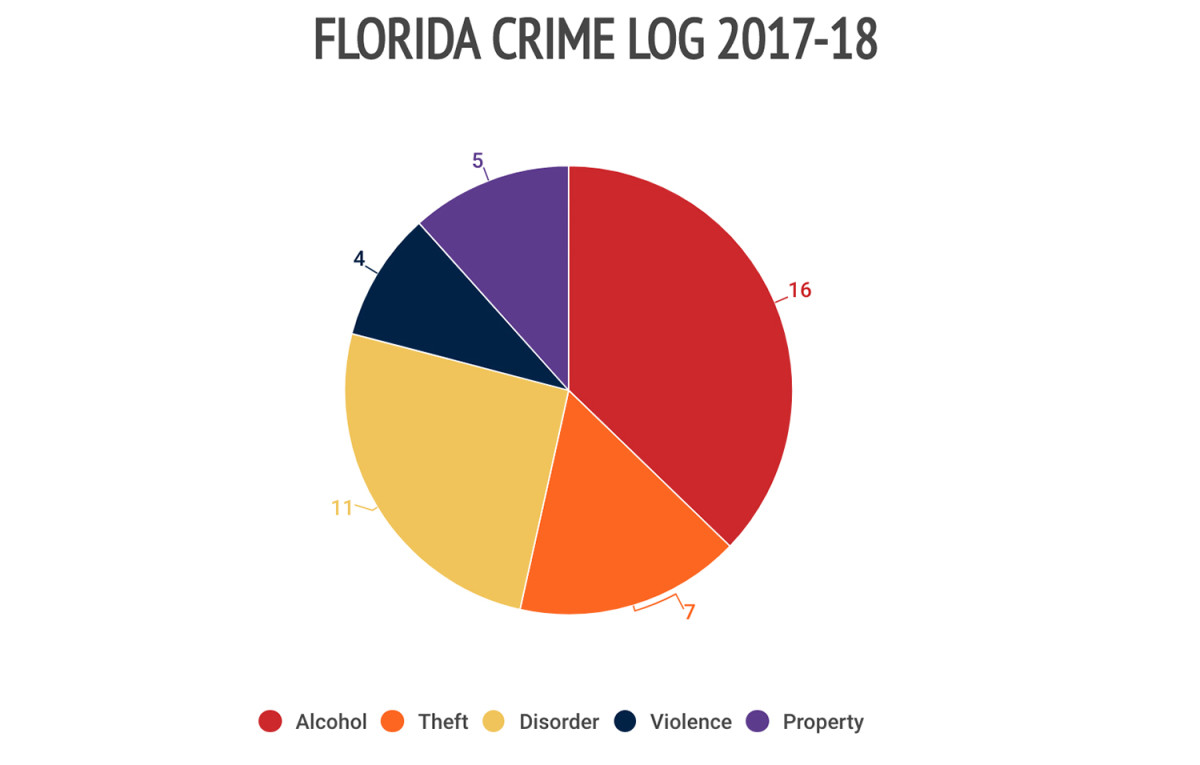
Over seven home games, campus police reported 16 alcohol-related incidents, six thefts, nine disorderly incidents, five property-related incidents, four drug-related incidents and four violent incidents.
Washington
Incident rate: 0.102
Conference: Pac-12
Undergraduate student body (2017): 30,933
Average game attendance (2017): 68,822
Location type: Urban
Number of home games: 6
Total number of police incidents on campus on gamedays: 42
Number incidents per gameday: 7
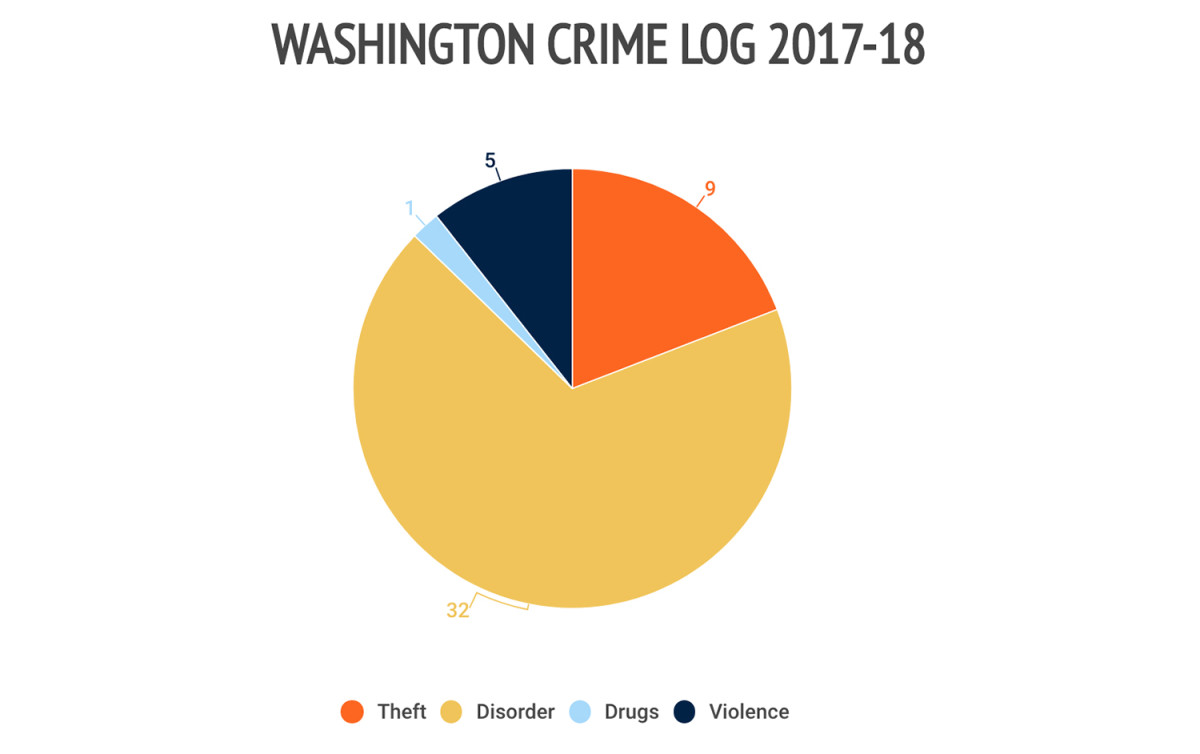
Over six home games, campus police reported 32 disorderly incidents, four thefts, five violent incidents and one drug-related incident.
Nebraska
Incident rate: 0.103
Conference: Big 10
Undergraduate student body (2017): 20,833
Average game attendance (2017): 90,200
Location type: City
Number of home games: 7
Total number of police incidents on campus on gamedays: 65
Number incidents per gameday: 9.29
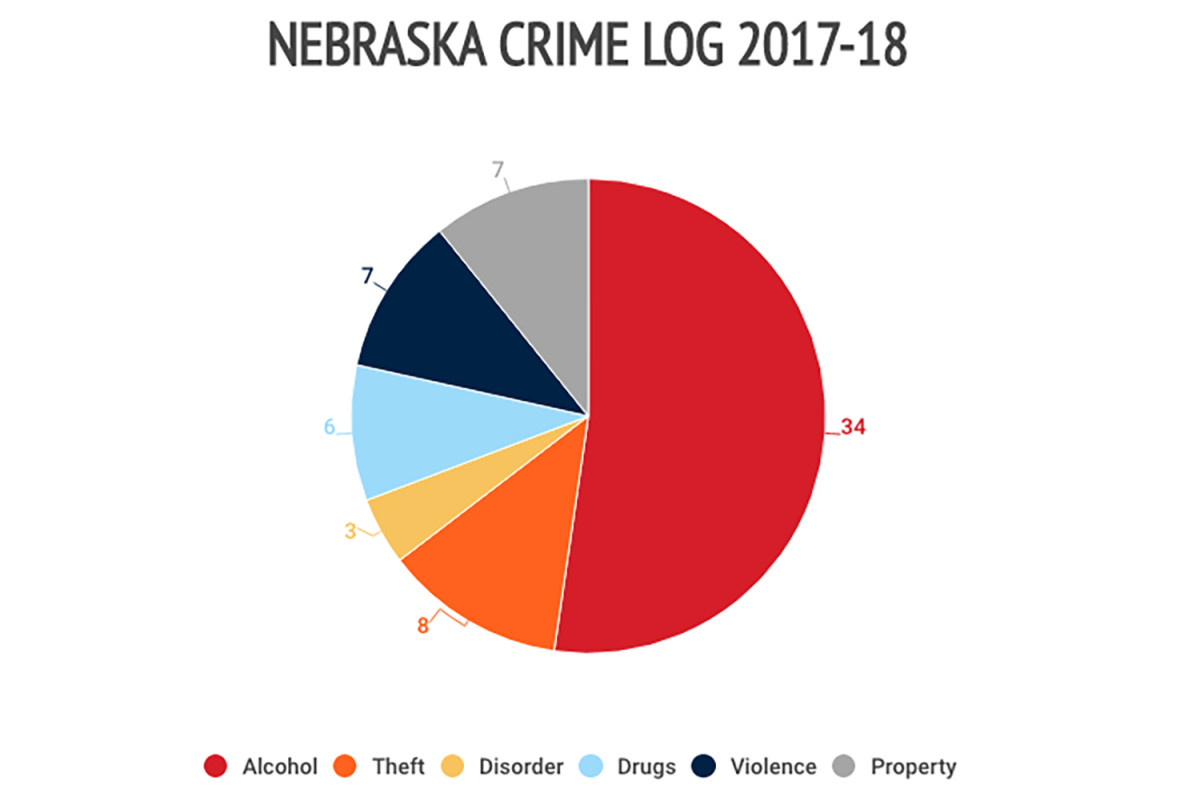
Over seven home games, campus police reported 34 alcohol-related incidents, seven violent incidents, six drug-related incidents, eight thefts, seven property crimes and three disorderly incidents.
In a report on Big 10 game day safety, Nebraska also recorded 25 stadium arrests and 141 stadium ejections. Additionally, campus police reported 17 medical transports for over intoxication.
Texas
Incident rate: 0.104
Conference: Big 12
Undergraduate student body (2017): 40,168
Average game attendance (2017): 92,778
Location type: Urban
Number of home games: 6
Total number of police incidents on campus on gamedays: 58
Number incidents per gameday: 9.67
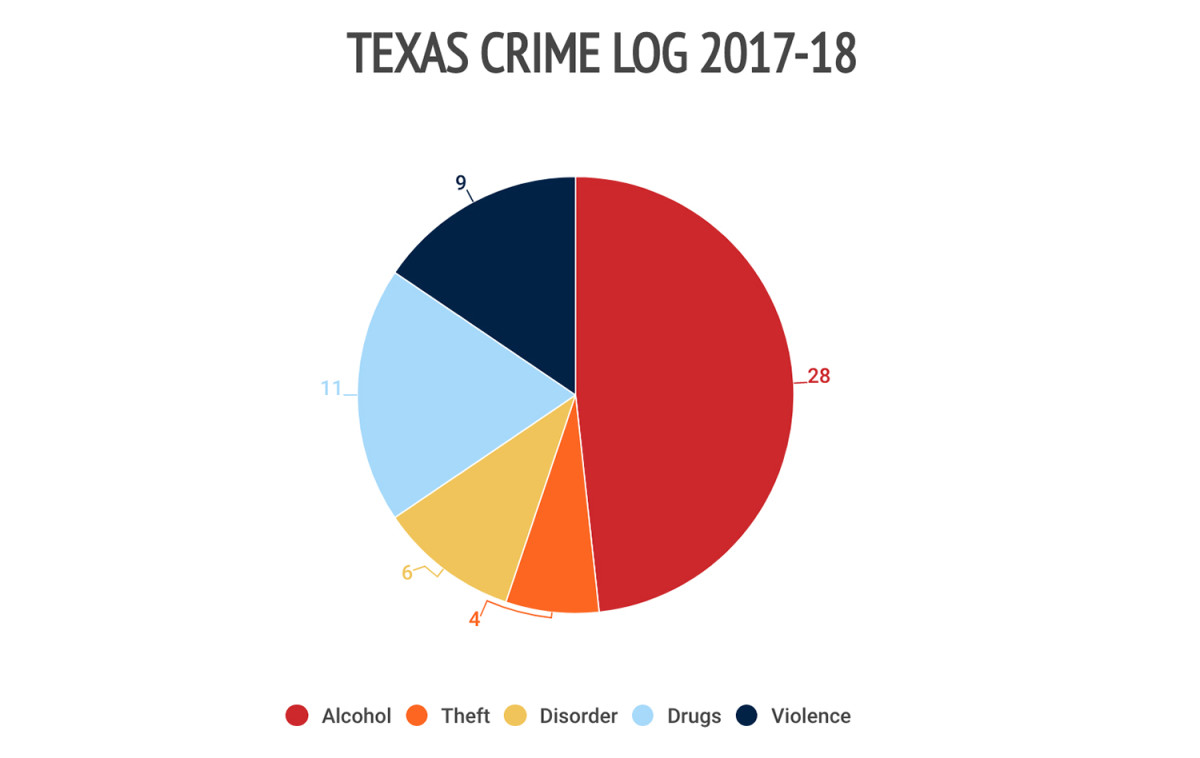
Over six home games, campus police reported 28 alcohol-related incidents, nine violent incidents, 11 drug-related incidents, six disorderly incidents and four thefts.
Arkansas
Incident rate: 0.106
Conference: SEC
Undergraduate student body (2017): 22,548
Average game attendance (2017): 63,224
Location type: City
Number of home games: 7
Total number of police incidents on campus on gamedays: 47
Number incidents per gameday: 6.71
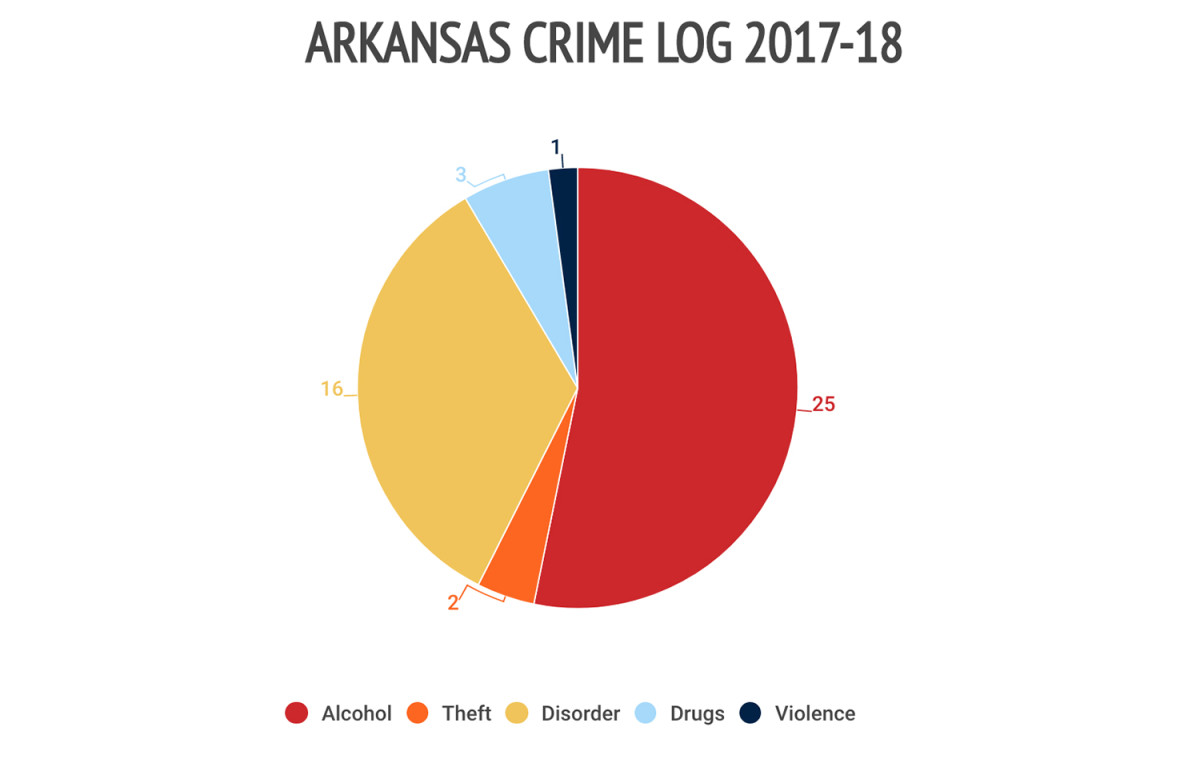
Over seven home games, campus police reported 25 alcohol-related incidents, 16 disorderly incidents, three drug-related incidents, two thefts and one violent incident.
Mississippi State
Incident rate: 0.110
Conference: SEC
Undergraduate student body (2017): 18,090
Average game attendance (2017): 58,100
Location type: Rural
Number of home games: 7
Total number of police incidents on campus on gamedays: 45
Number incidents per gameday: 6.4
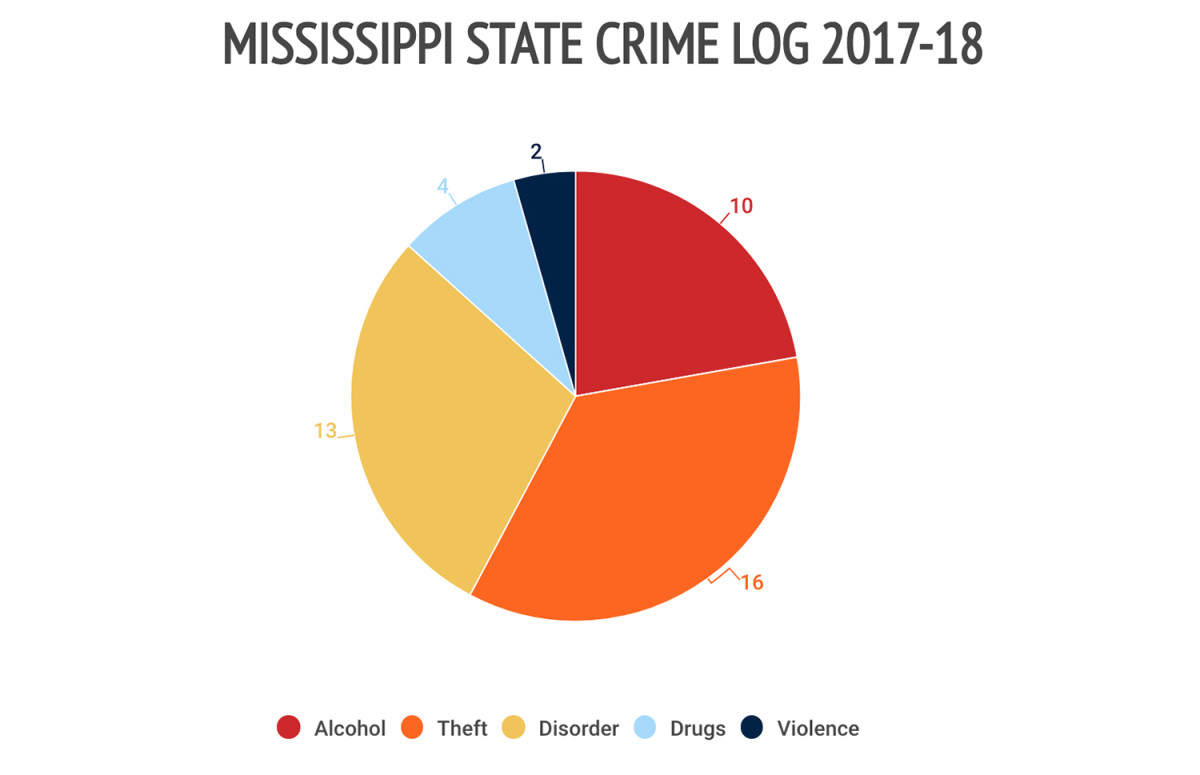
Over seven home games, campus police reported 16 theft incidents, 13 disorderly incidents, 10 alcohol-related incidents, four drug-related incidents and two violent incidents. Underage consumption accounted for one (10%) of the alcohol-related incidents.
Oklahoma State
Incident rate: 0.151
Conference: Big 12
Undergraduate student body (2017): 25,594
Average game attendance (2017): 56,790
Location type: City
Number of home games: 6
Total number of police incidents on campus on gamedays: 52
Number incidents per gameday: 8.6
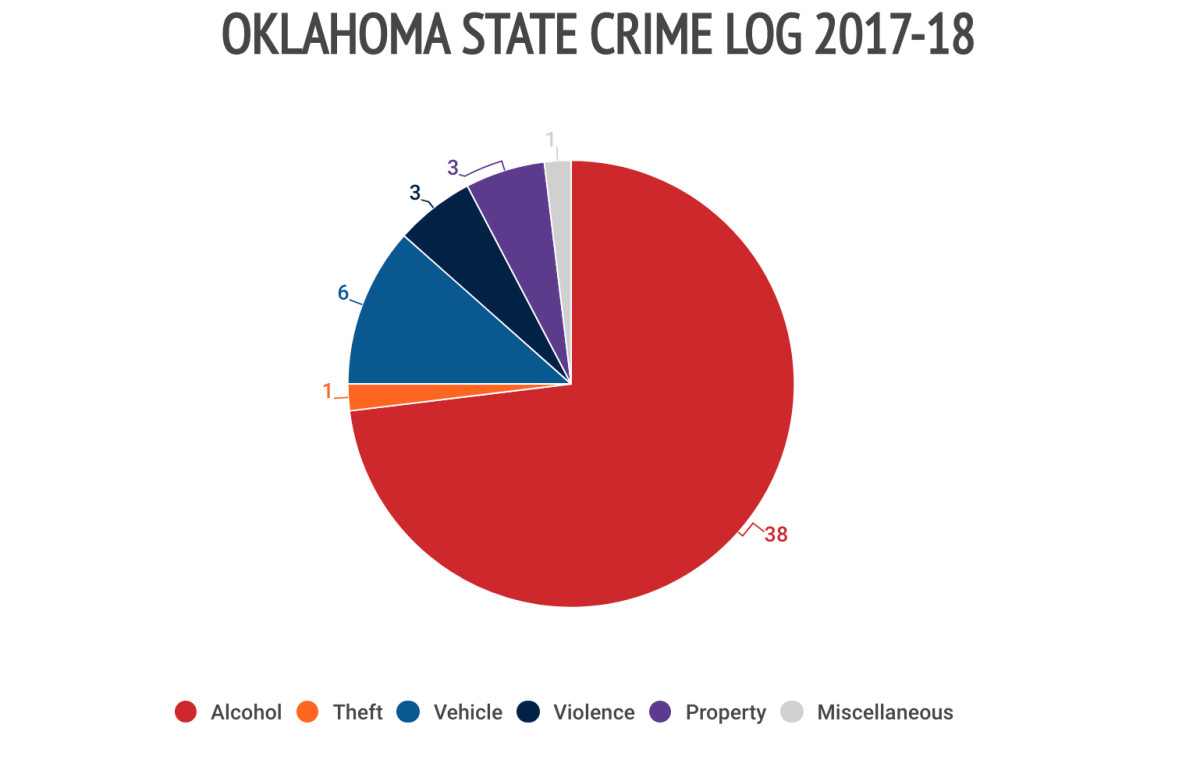
Over six home games, campus police reported 38 alcohol-related incidents, six vehicle-related incidents, three property crimes, three violent incidents, one theft and one incident classified as “miscellaneous.” One of the violent incidents was a sexual assault.
Oregon
Incident rate: 0.157
Conference: Pac-12
Undergraduate student body (2017): 20,049
Average game attendance (2017): 55,483
Location type: City
Number of home games: 7
Total number of police incidents on campus on gamedays: 61
Number incidents per gameday: 8.7
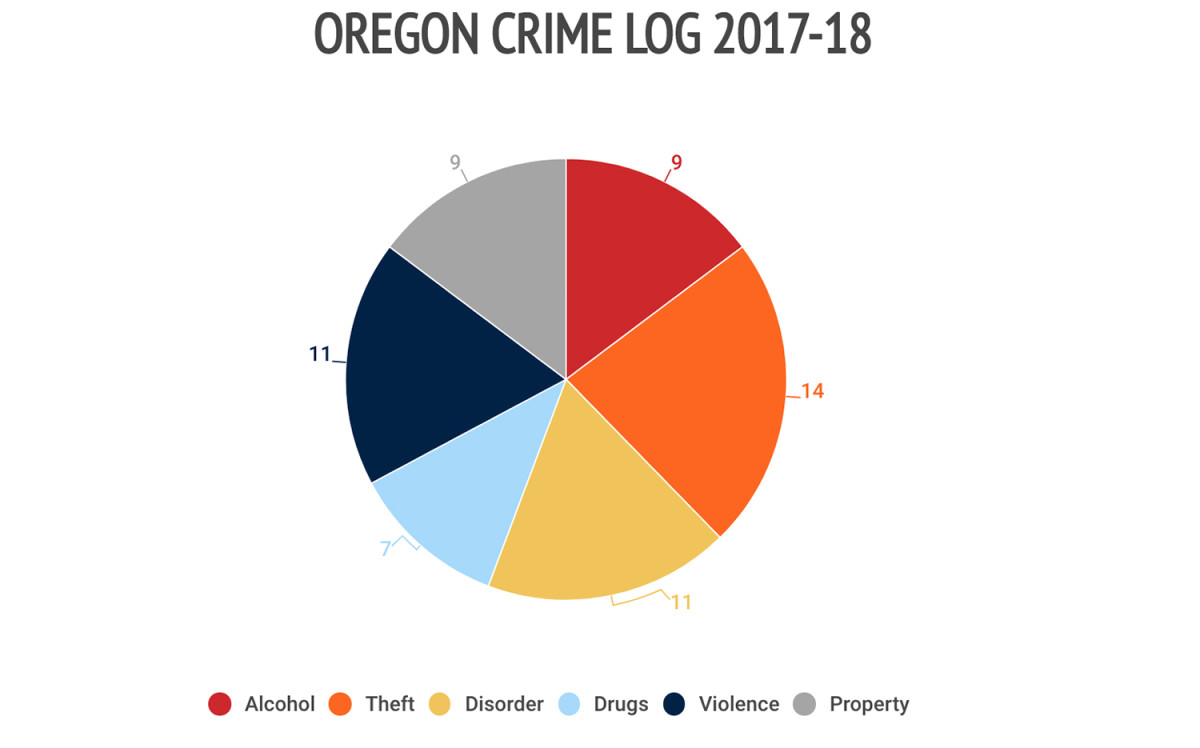
Over seven home games, campus police reported 14 thefts, 11 disturbances, 11 violent incidents, nine alcohol-related incidents, nine property crimes and seven drug-related incidents.
Iowa
Incident rate: 0.158
Conference: Big 10
Undergraduate student body (2017): 24,476
Average game attendance (2017): 66,337
Location type: City
Number of home games: 7
Total number of police incidents on campus on gamedays: 74
Number incidents per gameday: 10.5
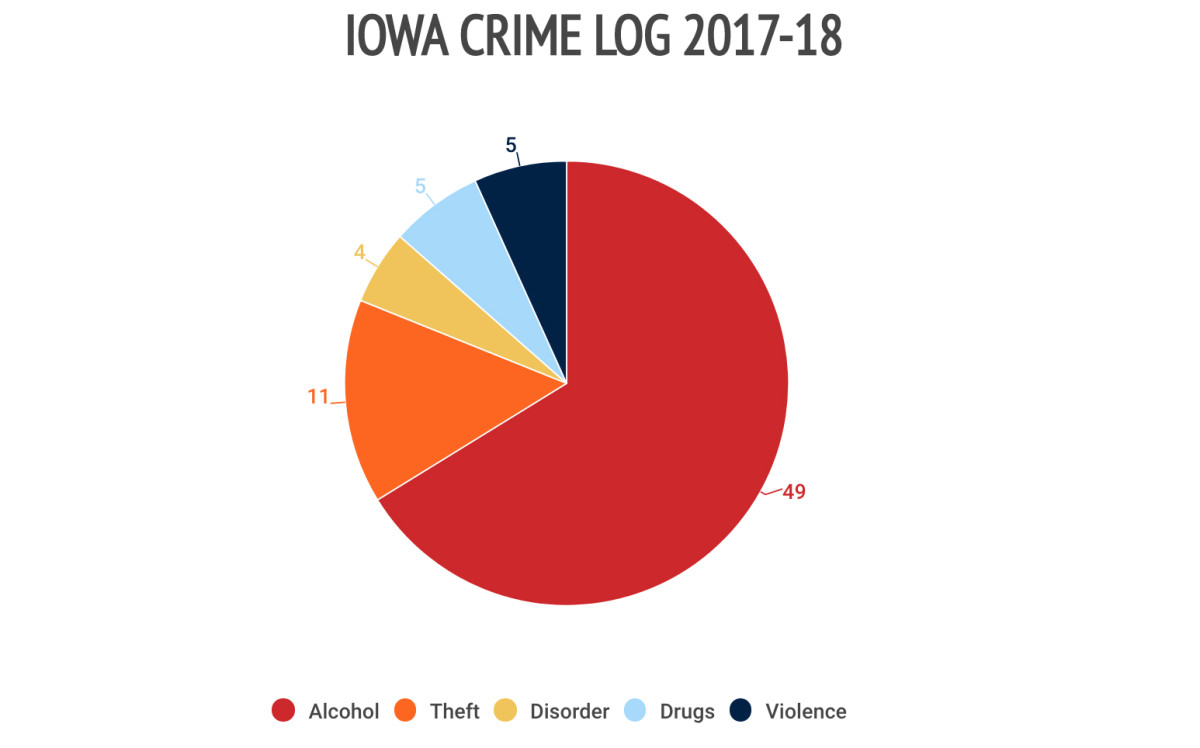
Over seven home games, campus police reported 49 alcohol-related incidents, 11 thefts, four disorderly incidents, five drug-related incidents and five violent incidents.
Purdue
Incident rate: 0.164
Conference: Big 10
Undergraduate student body (2017): 41,573
Average game attendance (2017): 47,883
Location type: Suburban
Number of home games: 6
Total number of police incidents on campus on gamedays: 47
Number incidents per gameday: 7.83
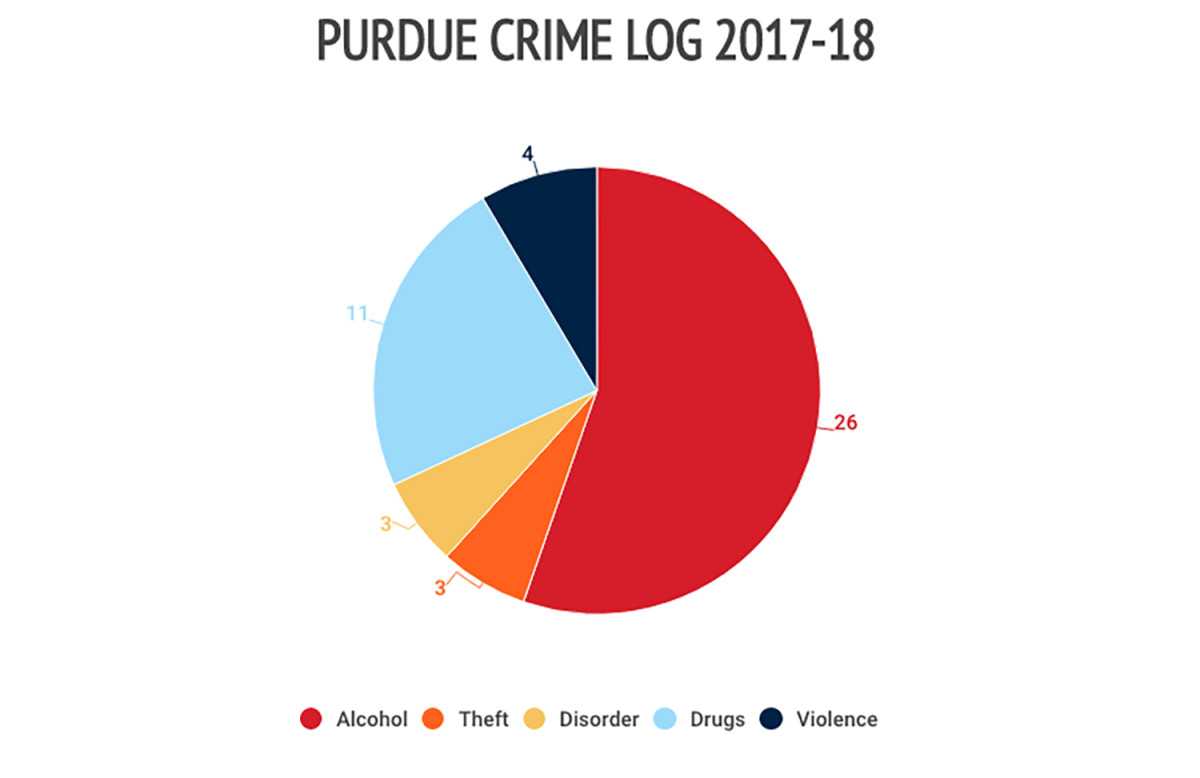
Over six home games, campus police reported 26 alcohol-related incidents, 11 drug-related incidents, four violent incidents, three thefts and three disorderly incidents.
Ohio State
Incident rate: 0.165
Conference: Big 10
Undergraduate student body (2017): 45,946
Average game attendance (2017): 107,495
Location type: Urban
Number of home games: 7
Total number of police incidents on campus on gamedays: 124
Number incidents per gameday: 17.7
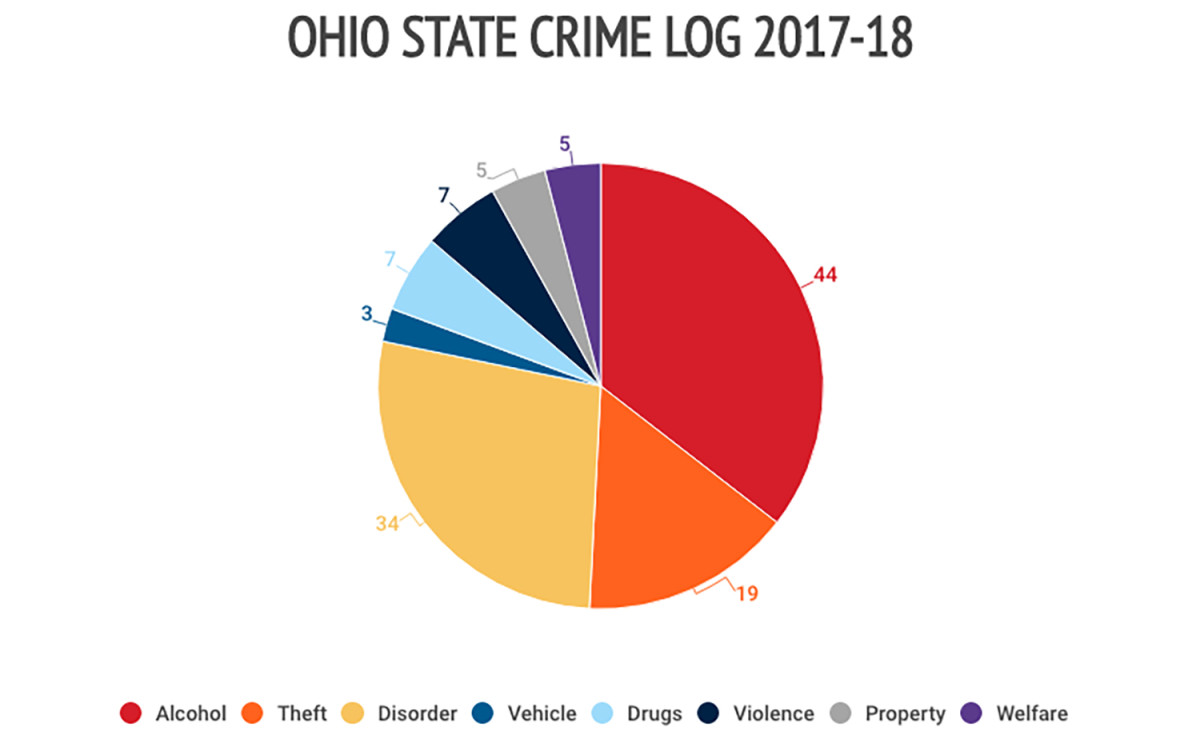
Over six home games, campus police reported 44 alcohol-related incidents, 34 disorderly incidents, 19 thefts, seven violent incidents, seven drug-related incidents, five property-related incidents, five welfare incidents and three vehicle-related incidents.
LSU
Incident rate: 0.176
Conference: SEC
Undergraduate student body (2017): 25,446
Average game attendance (2017): 98,506
Location type: Urban
Number of home games: 6
Total number of police incidents on campus on gamedays: 104
Number incidents per gameday: 17.3
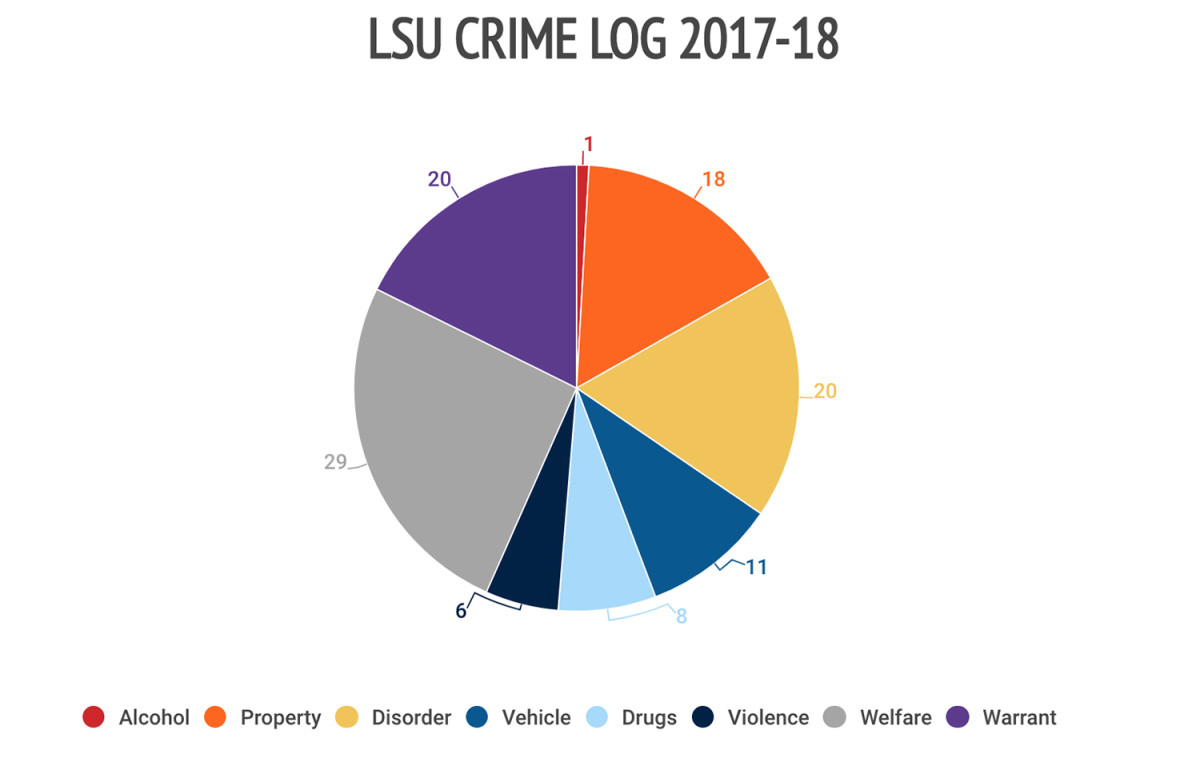
Over six home games, campus police reported 20 welfare incidents, 20 warrant arrests, 20 disorderly incidents, 18 property crimes, 11 vehicle-related incidents, eight drug-related incidents, six violent incidents and one alcohol-related incident. One of the violent incidents was a sexual assault.
Notre Dame
Incident rate: 0.182
Conference: N/A (Division I FBS Independents)
Undergraduate student body (2017): 8,530
Average game attendance (2017): 77,622
Location type: City
Number of home games: 7
Total number of police incidents on campus on gamedays: 99
Number incidents per gameday: 14.14
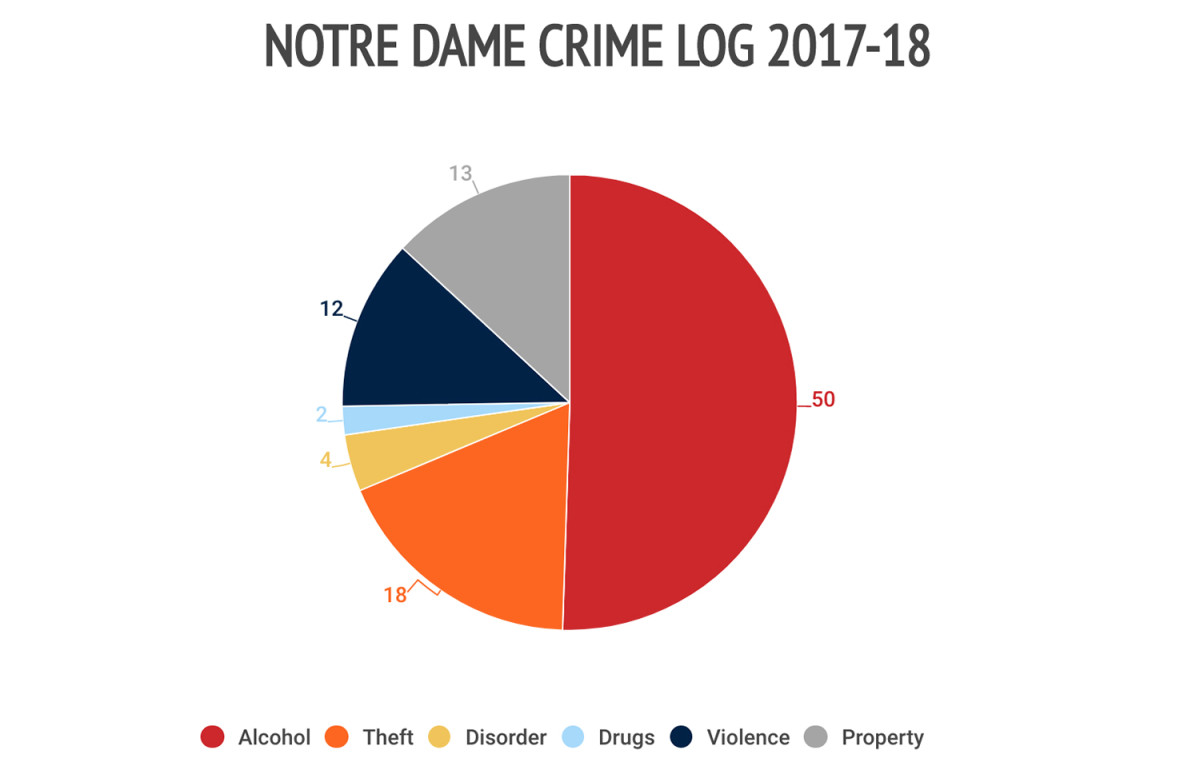
Over seven home games, campus police reported 50 alcohol-related incidents, 18 thefts, 13 property crimes, 12 violent incidents, four disorderly incidents and two drug-related incidents. Underage consumption accounted for 30 (59%) of the alcohol-related incidents. One of the violent incidents was a sexual assault.
Clemson
Incident rate: 0.189
Conference: ACC
Undergraduate student body (2017): 19,402
Average game attendance (2017): 80,773
Location type: Suburban
Number of home games: 7
Total number of police incidents on campus on gamedays: 107
Number incidents per gameday: 15.3
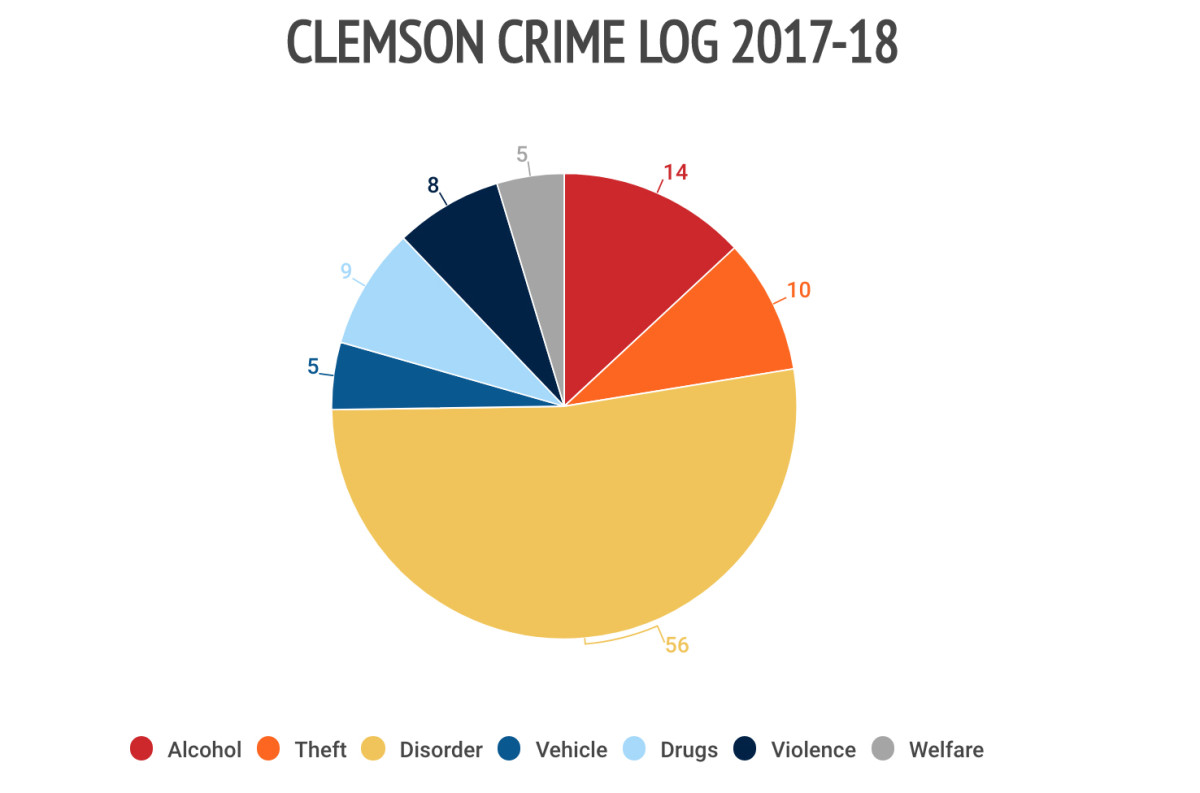
Over seven home games, campus police reported 56 disorderly incidents, 14 alcohol-related incidents, 10 thefts, nine drug-related incidents, eight violent incidents, five welfare-related incidents and five vehicle-related incidents. Underage consumption accounted for one of the alcohol-related incidents.
Michigan State
Incident rate: 0.189
Conference: Big 10
Undergraduate student body (2017): 38,996
Average game attendance (2017): 72,485
Location type: Suburban
Number of home games: 7
Total number of police incidents on campus on gamedays: 96
Number incidents per gameday: 13.7
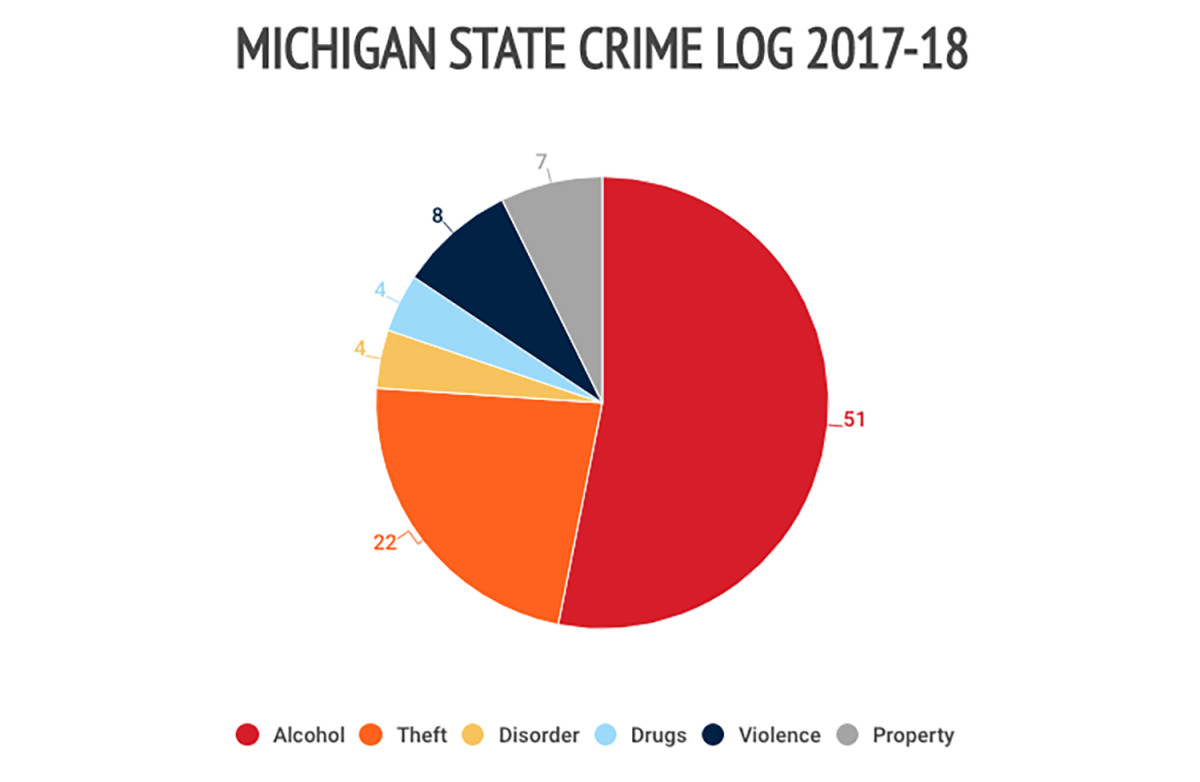
Over seven home games, campus police reported 51 alcohol-related incidents, 22 thefts, eight violent incidents, seven property crimes, four drug-related incidents and four disorderly incidents. There were no reports logged for a gameday on November 18
Georgia
Incident rate: 0.203
Conference: SEC
Undergraduate student body (2017): 28,848
Average game attendance (2017): 92,746
Location type: City
Number of home games: 6
Total number of police incidents on campus on gamedays: 113
Number incidents per gameday: 18.8
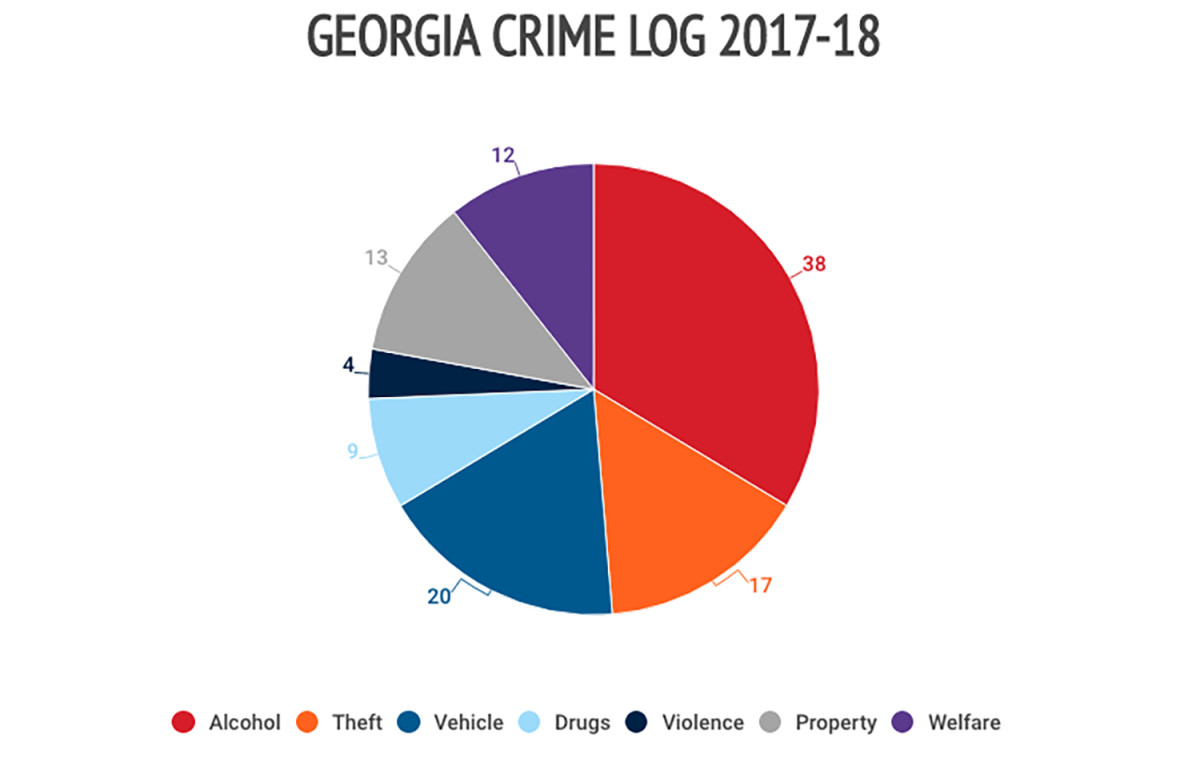
Over six home games, campus police reported nine drug-related offenses; 12 welfare incidents; 38 alcohol-related offenses; 20 vehicle incidents; 17 thefts, robberies or burglaries; and four violent offenses.
Florida State
Incident rate: 0.223
Conference: ACC
Undergraduate student body (2017): 32,812
Average game attendance (2017): 70,943
Location type: City
Number of home games: 6
Total number of police incidents on campus on gamedays: 95
Number incidents per gameday: 15.8
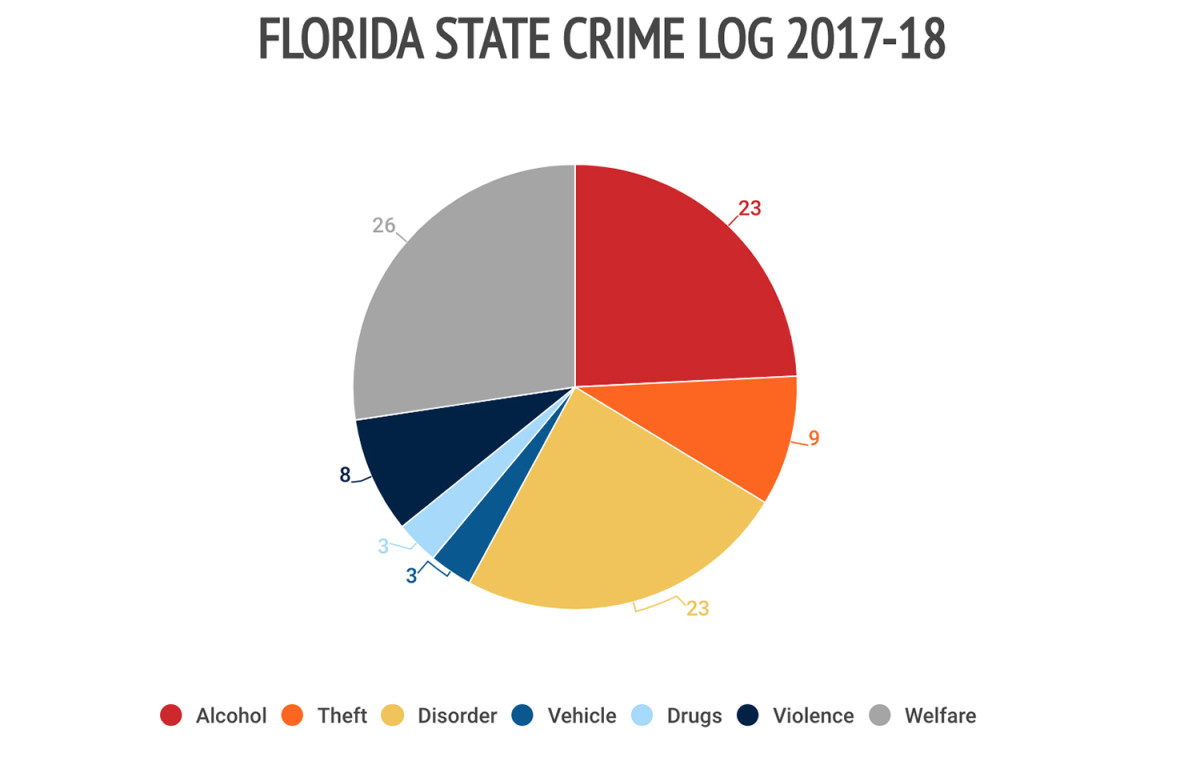
Over six home games, police responded to 26 reports of a sick/injured/intoxicated student; 23 alcohol-related incidents; 23 disorderly incidents; three drug offenses; three vehicle offenses; nine theft incidents and eight violence incidents.
South Carolina
Incident rate: 0.23
Conference: SEC
Undergraduate student body (2017): 25,556
Average game attendance (2017): 78,586
Location type: City
Number of home games: 7
Total number of police incidents on campus on gamedays: 124
Number incidents per gameday: 17.7
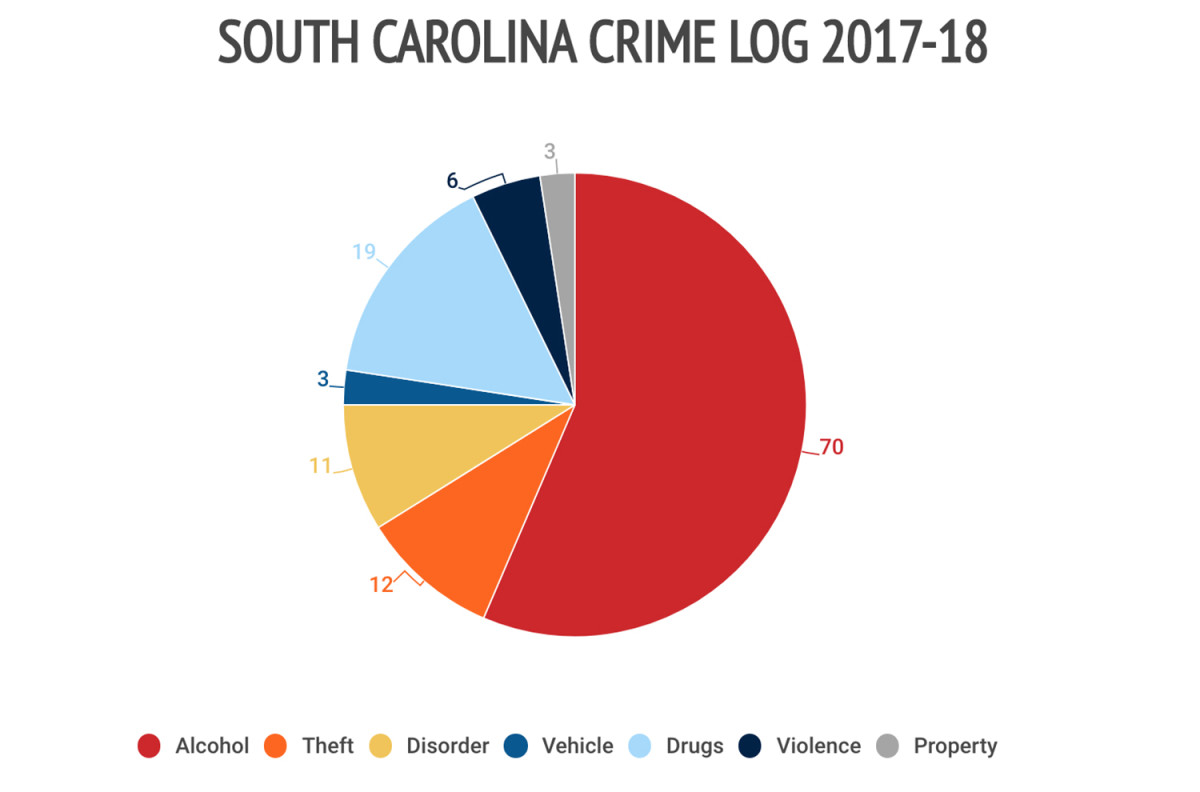
Over seven home games, campus police reported 70 alcohol-related incidents, 19 drug-related incidents, 12 thefts, 11 disorderly incidents, six violent incidents, three vehicle incidents and three for property crime. One of the violent incidents was a sexual assault.
Tennessee
Incident rate: 0.248
Conference: SEC
Undergraduate student body (2017): 22,317
Average game attendance (2017): 95,779
Location type: Urban
Number of home games: 7
Total number of police incidents on campus on gamedays: 167
Number incidents per gameday: 23.8
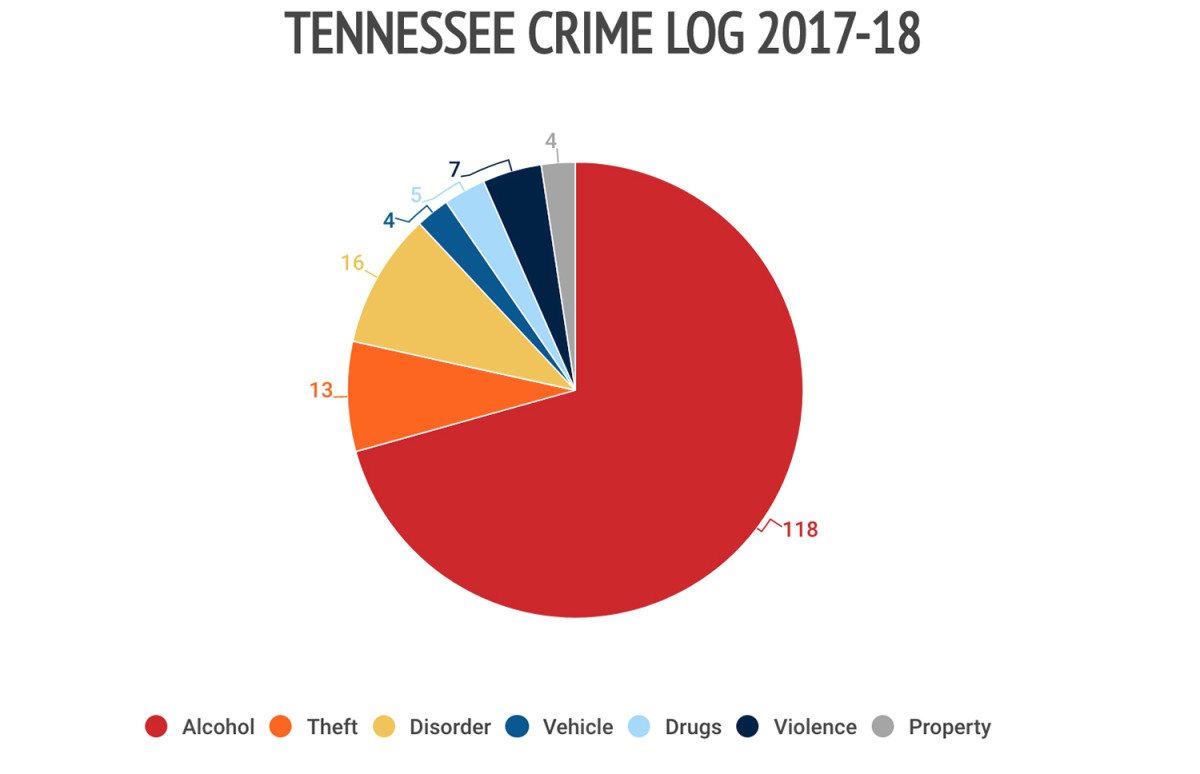
Over seven home games, campus police reported 118 alcohol-related incidents, 16 disorderly incidents, 13 thefts, seven violent incidents, five drug-related incidents, four vehicle-related incidents and four property crimes. Additionally, the university reported 27 stadium arrests and 51 stadium ejections.
West Virginia
Incident rate: 0.261
Conference: Big 12
Undergraduate student body (2017): 22,350
Average game attendance (2017): 55,946
Location type: Suburban
Number of home games: 7
Total number of police incidents on campus on gamedays: 102
Number incidents per gameday: 14.6
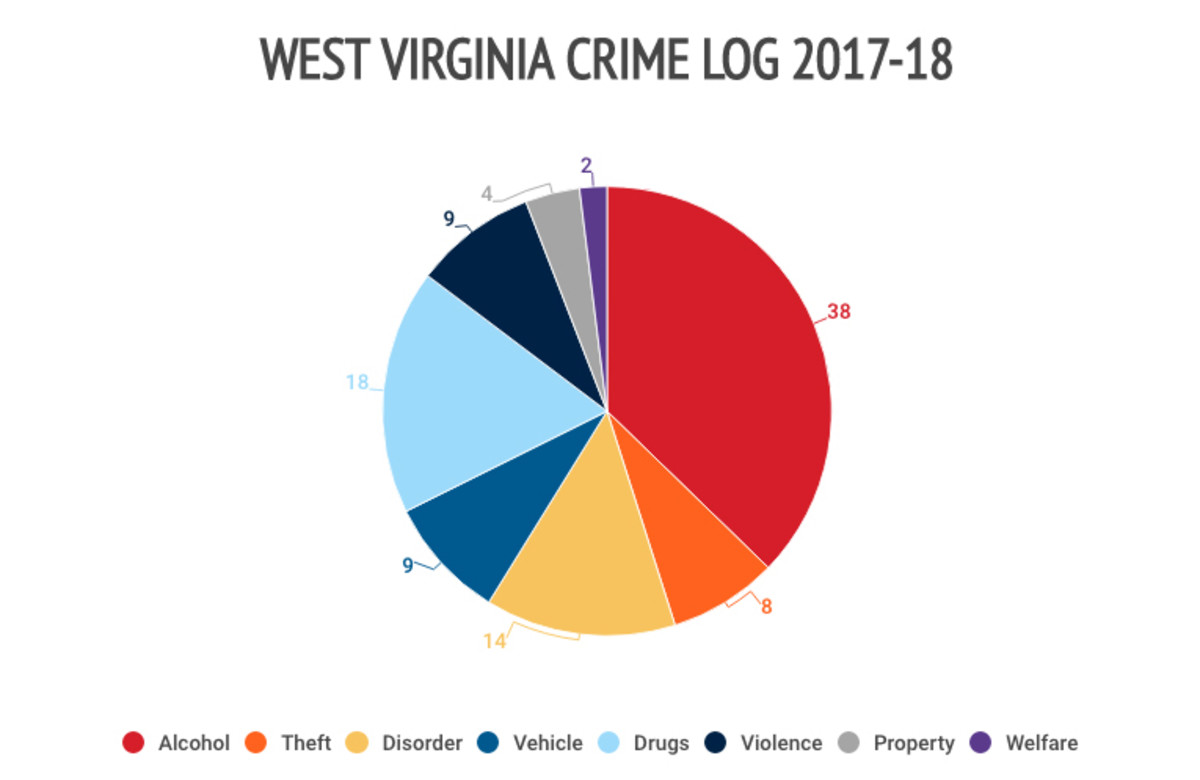
Over seven home games, campus police reported 38 alcohol-related incidents, 14 disorderly incidents, 18 drug-related incidents, nine vehicle-related incidents, nine violent incidents, eight thefts, four property-related incidents and two welfare incidents. Three of the violent incidents were sexual assaults. Additionally, campus police recorded 13 medical transports for over intoxication.
USC
Incident rate: 0.268
Conference: Pac-12
Undergraduate student body (2017): 19,000
Average game attendance (2017): 72,683
Location type: Urban
Number of home games: 7
Total number of police incidents on campus on gamedays: 137
Number incidents per gameday: 19.5
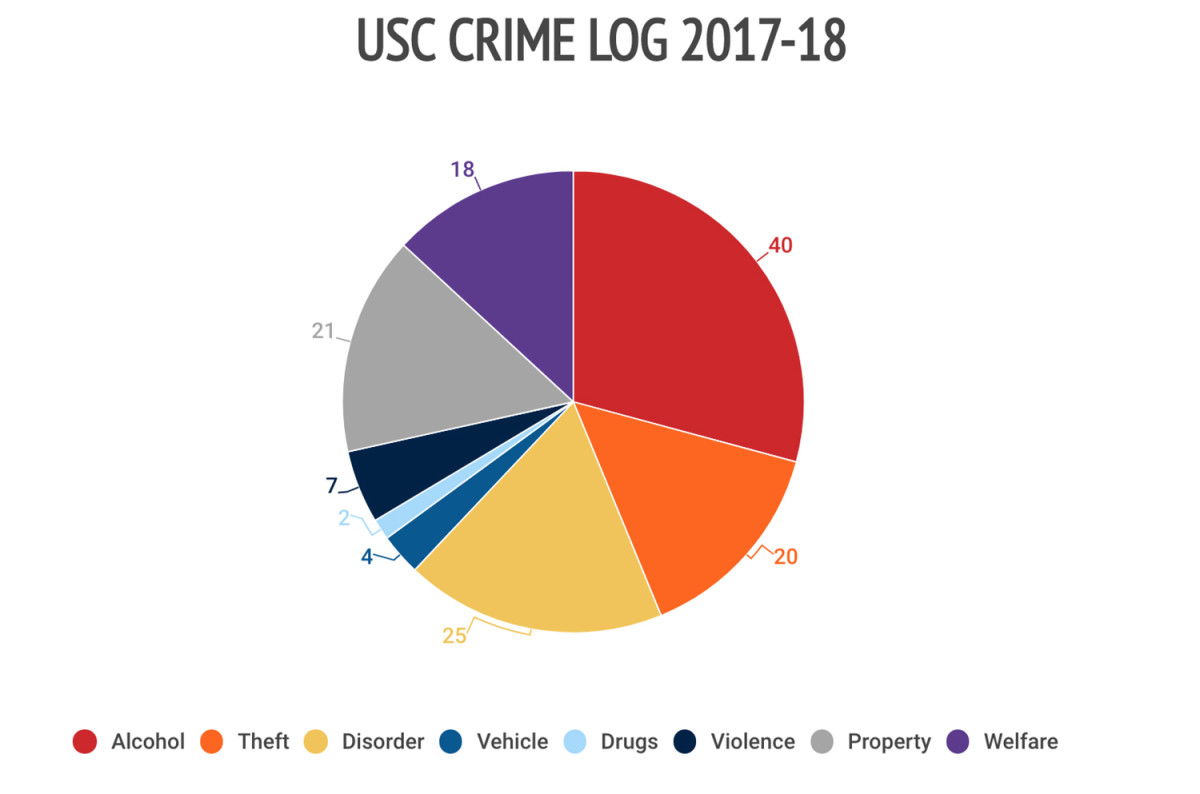
Over seven home games, campus police reported 40 alcohol-related incidents, 25 disorderly incidents, 20 thefts, 21 property crimes, 18 welfare incidents, four vehicle-related incidents, seven violent incidents and two drug-related incidents. One of the violent incidents was sexual assault. Additionally, campus police recorded 12 medical transports for over intoxication.
Michigan
Incident rate: 0.284
Conference: Big 10
Undergraduate student body (2017): 29,821
Average game attendance (2017): 111,589
Location type: City
Number of home games: 6
Total number of police incidents on campus on gamedays: 190
Number incidents per gameday: 31.67
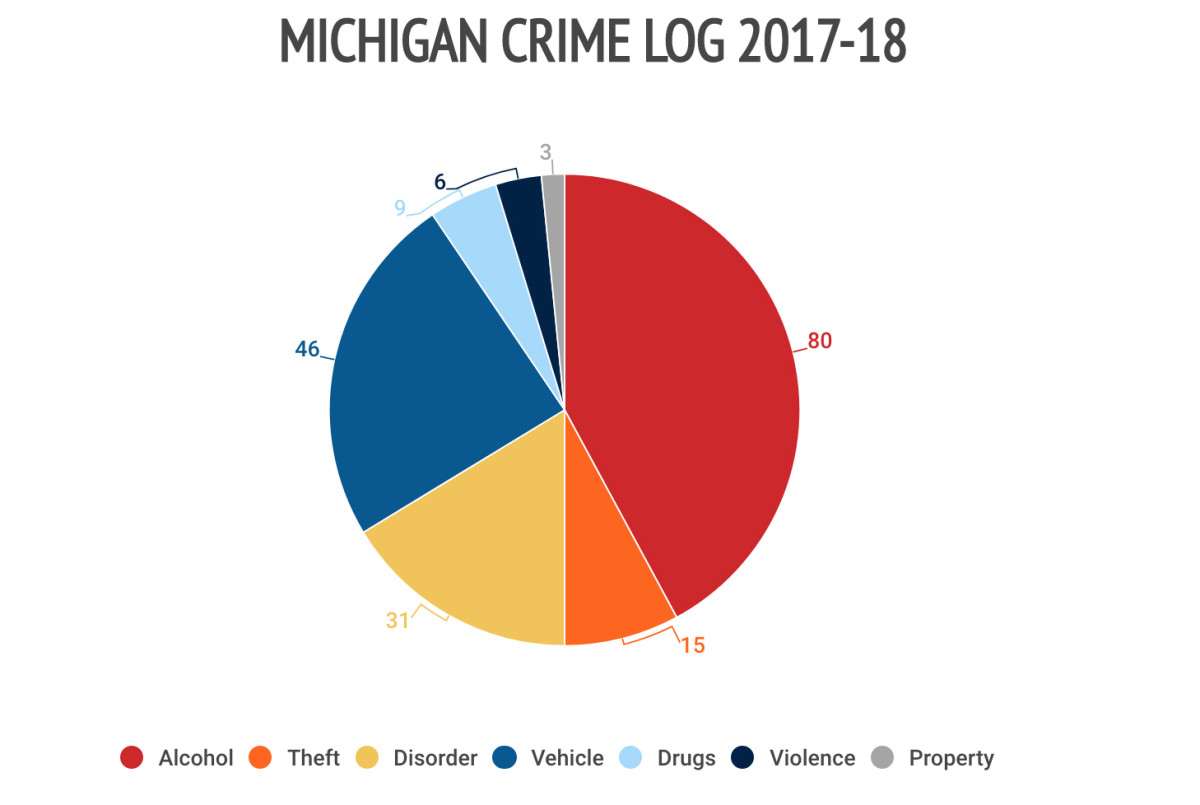
Over six home games, campus police reported 80 alcohol-related incidents, 46 vehicle-related incidents, 31 disorderly incidents, 15 thefts, nine drug-related incidents, six violent incidents and three property crimes. Three of the violent crimes were sexual assaults.
In a report on Big 10 game day safety, Michigan also recorded 15 stadium arrests and 139 stadium ejections. Additionally, campus police reported 16 medical transports for over-intoxication.
Auburn
Incident rate: 0.382
Conference: SEC
Undergraduate student body (2017): 23,964
Average game attendance (2017): 86,446
Location type: Suburban
Number of home games: 7
Total number of police incidents on campus on gamedays: 231
Number incidents per gameday: 33
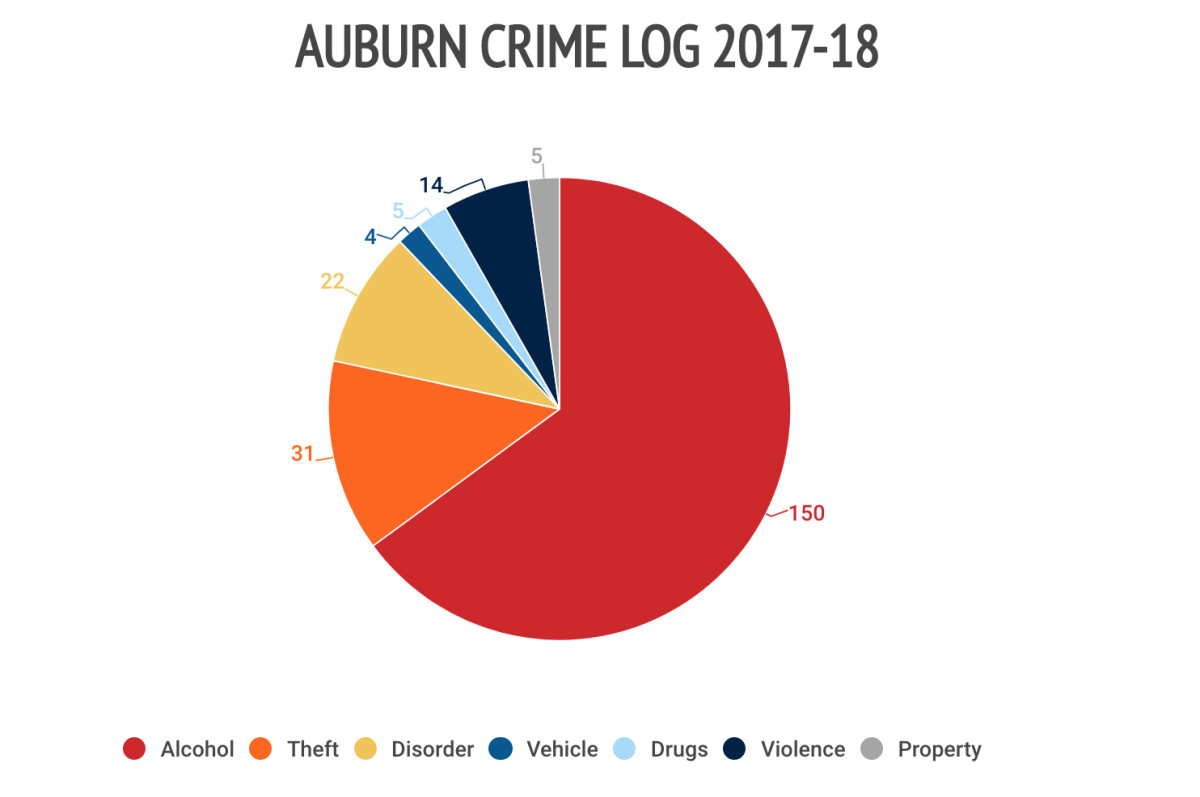
Over seven games, campus police reported 150 alcohol-related incidents, 31 disorderly incidents, 22 thefts, 14 violent incidents, five drug-related incidents, five property crimes and four vehicle related incidents. One of the violent incidents was sexual assault.
UCF
Incident rate: 0.40
Conference: AAC
Undergraduate student body (2017): 55,773
Average game attendance (2017): 36,846
Location type: Suburban
Number of home games: 6
Total number of police incidents on campus on gamedays: 89
Number incidents per gameday: 14.83
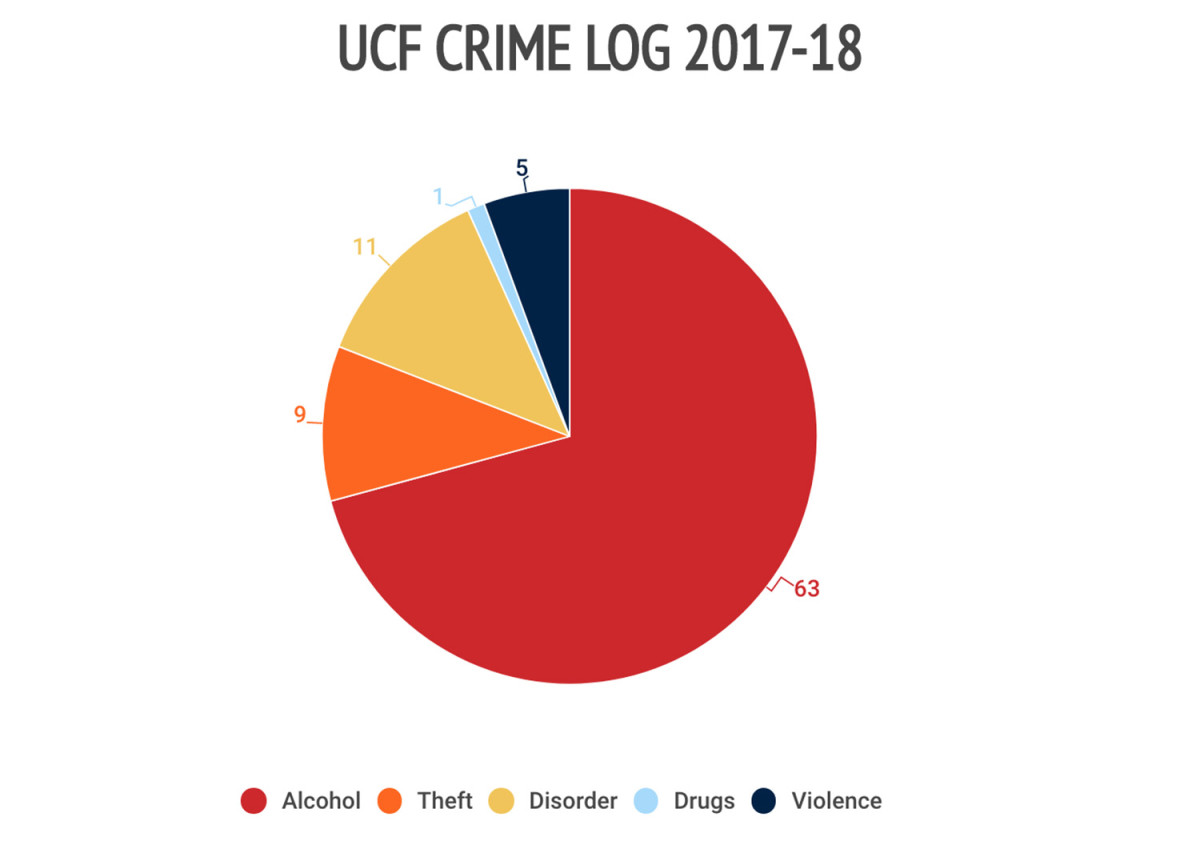
Over six home games, campus police reported 63 alcohol-related incidents, 11 disorderly incidents, nine thefts, five violent incidents and one drug-related incident. One of the violent offenses was a sexual assault.
Texas A&M
Incident rate: 0.416
Conference: SEC
Undergraduate student body (2017): 68,625
Average game attendance (2017): 98,802
Location type: City
Number of home games: 8
Total number of police incidents on campus on gamedays: 329
Number incidents per gameday: 41.1
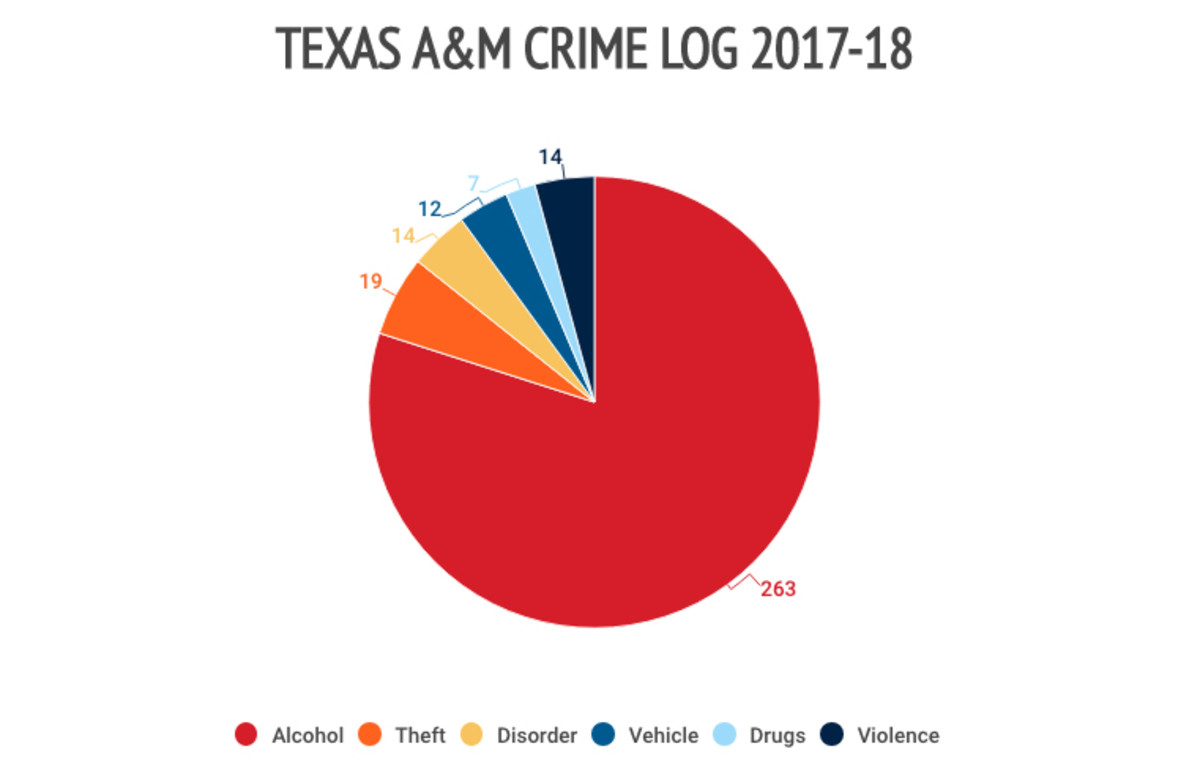
Over eight home games, campus police reported 263 alcohol-related incidents, 19 thefts, 14 violent incidents, 14 disorderly incidents, 12 vehicle-related offenses and seven drug-related incidents.
Ole Miss
Incident rate: 0.495
Conference: SEC
Undergraduate student body (2017): 18,517
Average game attendance (2017): 58,631
Location type: Rural
Number of home games: 8
Total number of police incidents on campus on gamedays: 232
Number incidents per gameday: 29
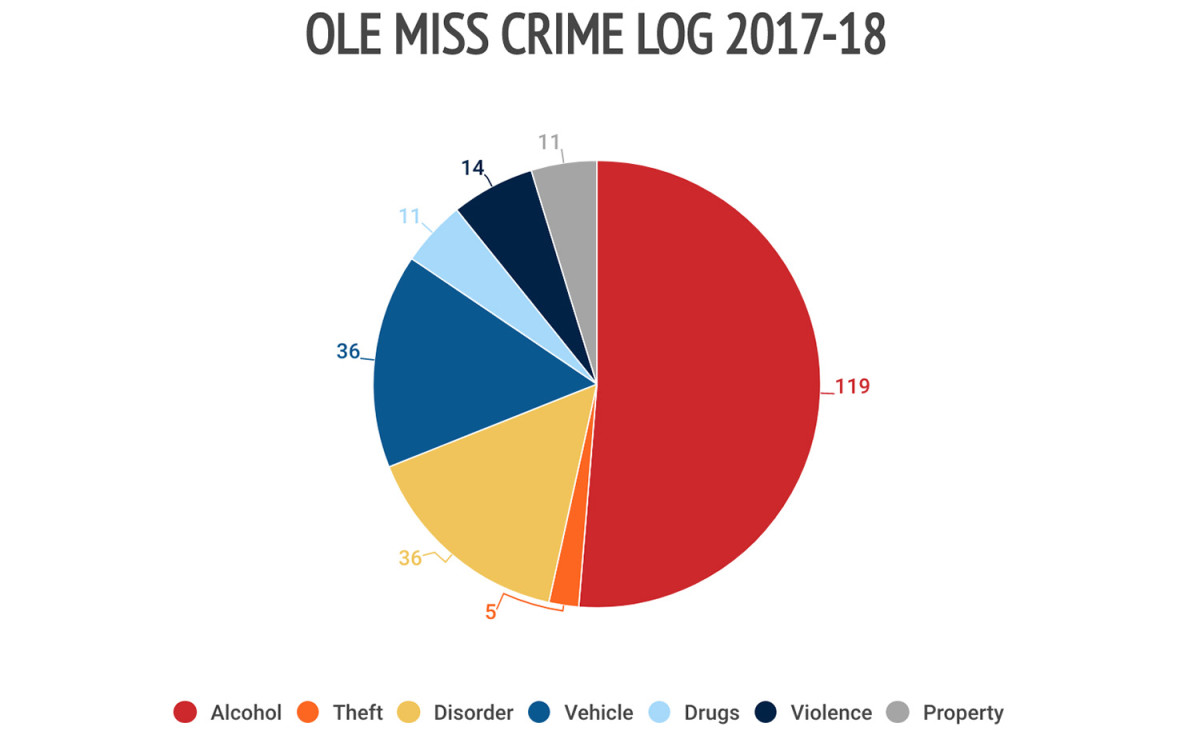
Over eight home games, campus police reported 119 alcohol incidents, 36 vehicle-related offenses, 36 disorderly incidents, 14 violent incidents, 11 property incidents, 11 drug-related incidents and five thefts. Additionally, campus police recorded 41 medical transports for over intoxication.
Arizona
Incident rate: 0.51
Conference: Pac-12
Undergraduate student body (2017): 44,831
Average game attendance (2017): 42,632
Location type: City
Number of home games: 6
Total number of police incidents on campus on gamedays: 130
Number incidents per gameday: 21.7
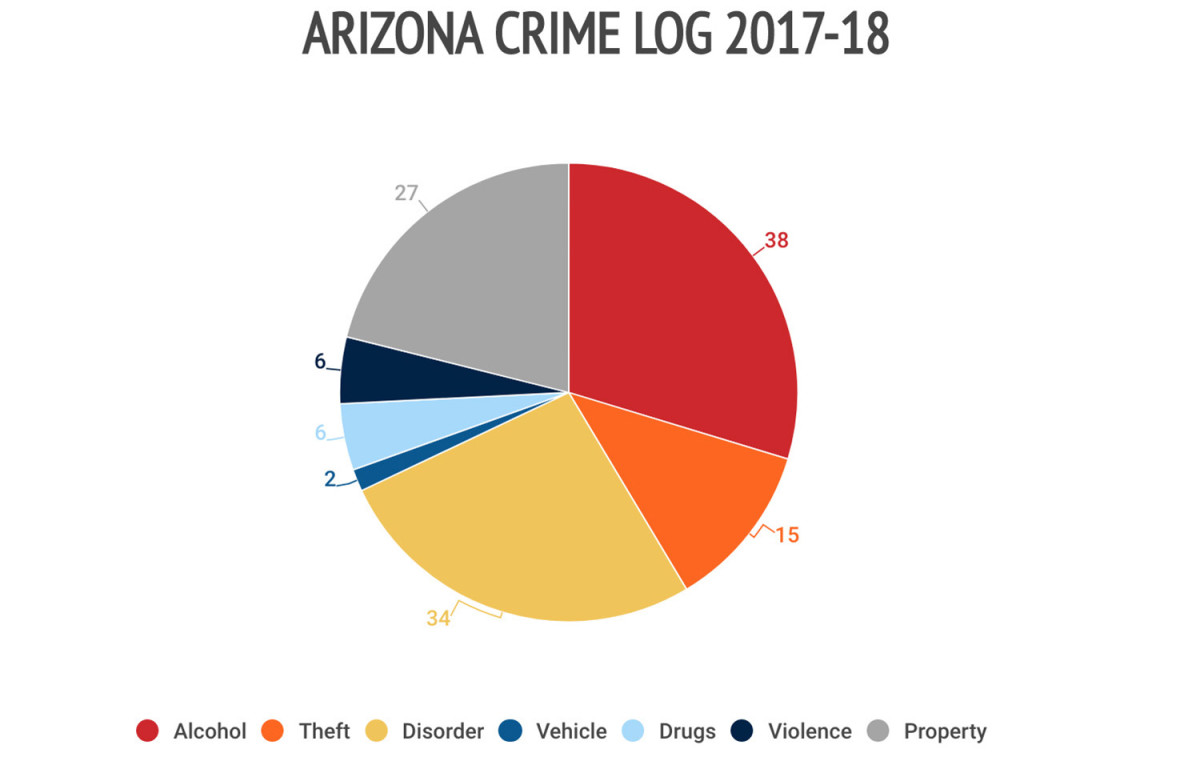
Over six home games, campus police reported 38 alcohol-related incidents, 34 disorderly incidents, 27 property crimes, 15 thefts, six drug-related incidents, six violent incidents and two vehicle-related incidents. Underage drinking offenses accounted for 28 of the 38 alcohol-related incidents.
Wisconsin
Incident rate: 0.55
*Data pulled from both city and campus police.
Conference: Big 10
Undergraduate student body (2017): 29,931
Average game attendance (2017): 78,824
Location type: City
Number of home games: 7
Total number of police incidents on campus on gamedays: 303
Number incidents per gameday: 43.3
Wisconsin was unique to all of the other schools in the report, because it recorded information from both the city and campus police in its crime logs.
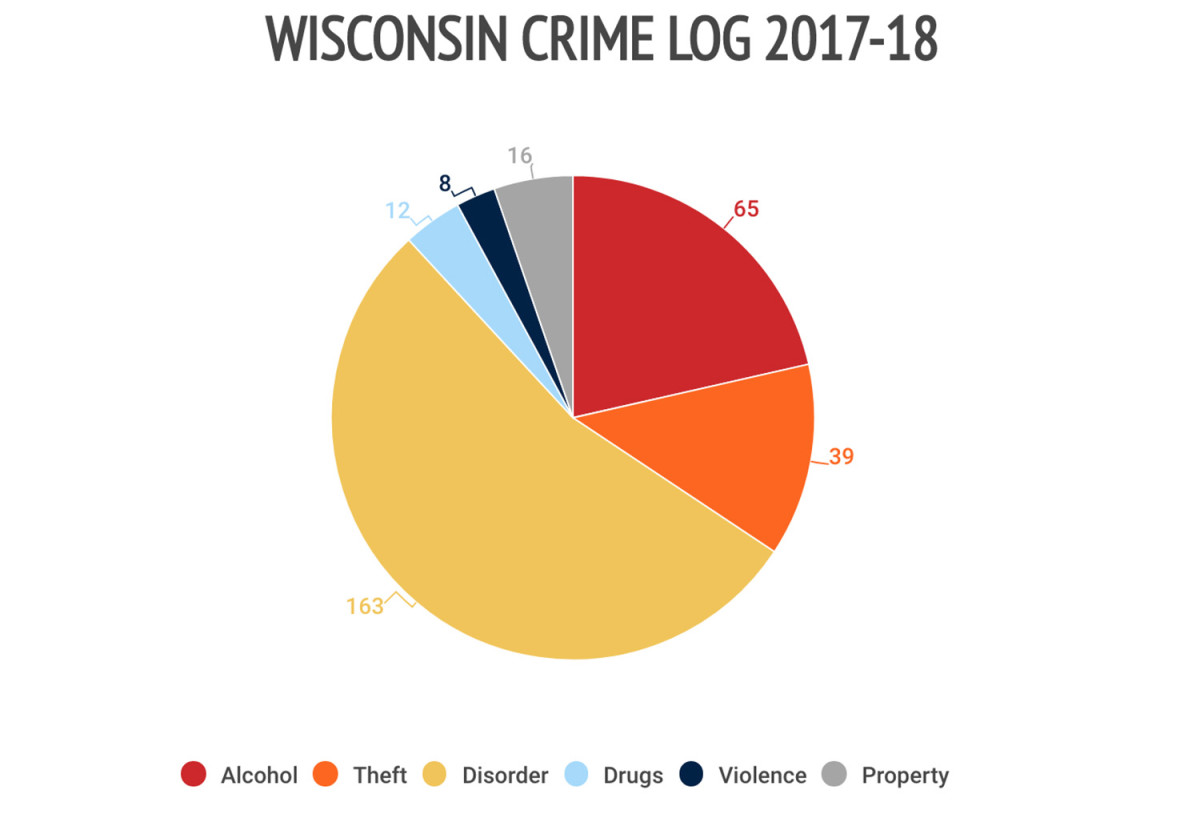
Over seven home games, the two departments reported 163 disorderly incidents, 65 alcohol-related incidents, 39 thefts, 16 property crimes, 12 drug-related incidents and eight violent incidents. Additionally, in a report on Big 10 game day safety, Wisconsin also recorded 137 stadium arrests and 167 stadium ejections.
Iowa State
Incident rate: 0.699
Conference: Big 12
Undergraduate student body (2017): 30,671
Average game attendance (2017): 57,931
Location type: City
Number of home games: 6
Total number of police incidents on campus on gamedays: 243
Number incidents per gameday: 40.5
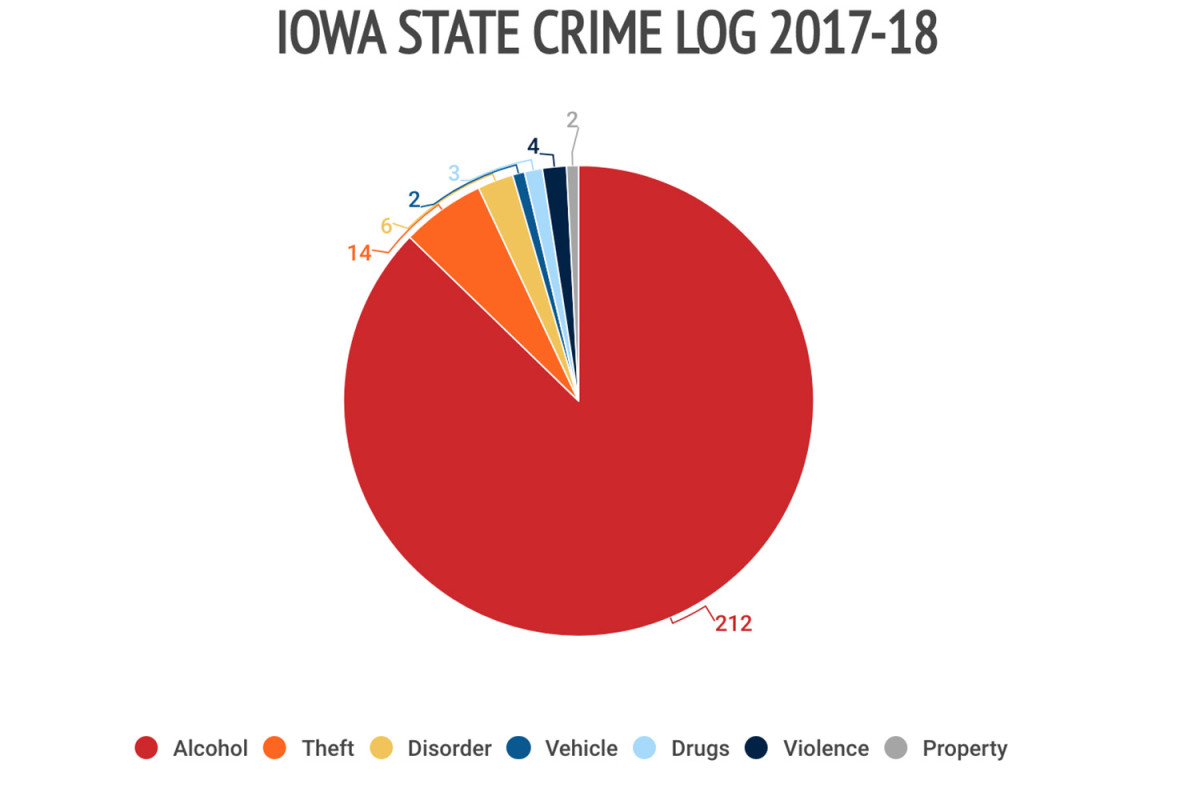
Over six home games, campus police reported 212 alcohol-related incidents, 14 thefts, six disorderly incidents, two property crimes, four violent incidents, three drug-related incidents and two vehicle-related incidents.
Alabama
Incident rate: 0.733
Conference: SEC
Undergraduate student body (2017): 32,563
Average game attendance (2017): 101,722
Location type: Suburban
Number of home games: 6
Total number of police incidents on campus on gamedays: 448
Number incidents per gameday: 74.6
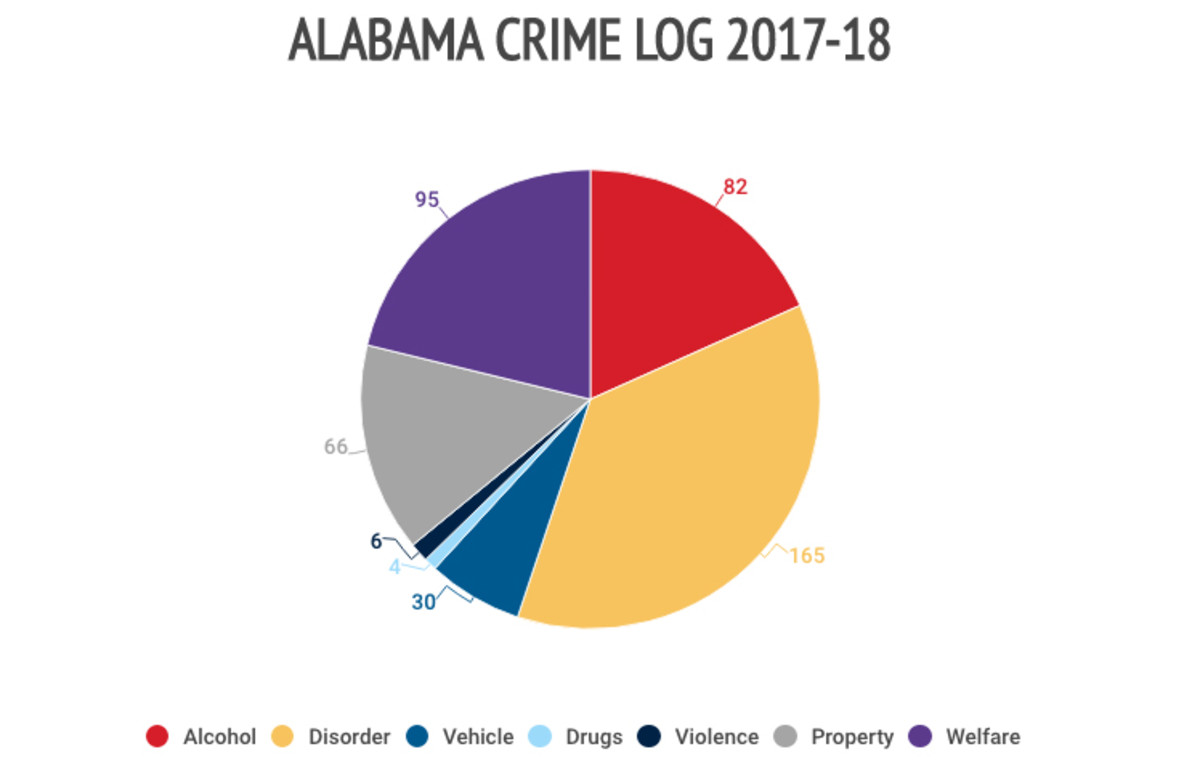
Over six home games, campus police reported 165 disorderly incidents, 95 welfare-related incidents, 82 alcohol-related incidents, 30 vehicle-related incidents, 66 property crimes, six violent incidents and four drug-related incidents.
Virginia Tech
Incident rate: 0.753
Conference: ACC
Undergraduate student body (2017): 27,140
Average game attendance (2017): 63,214
Location type: Rural
Number of home games: 6
Total number of police incidents on campus on gamedays: 286
Number incidents per gameday: 47.6
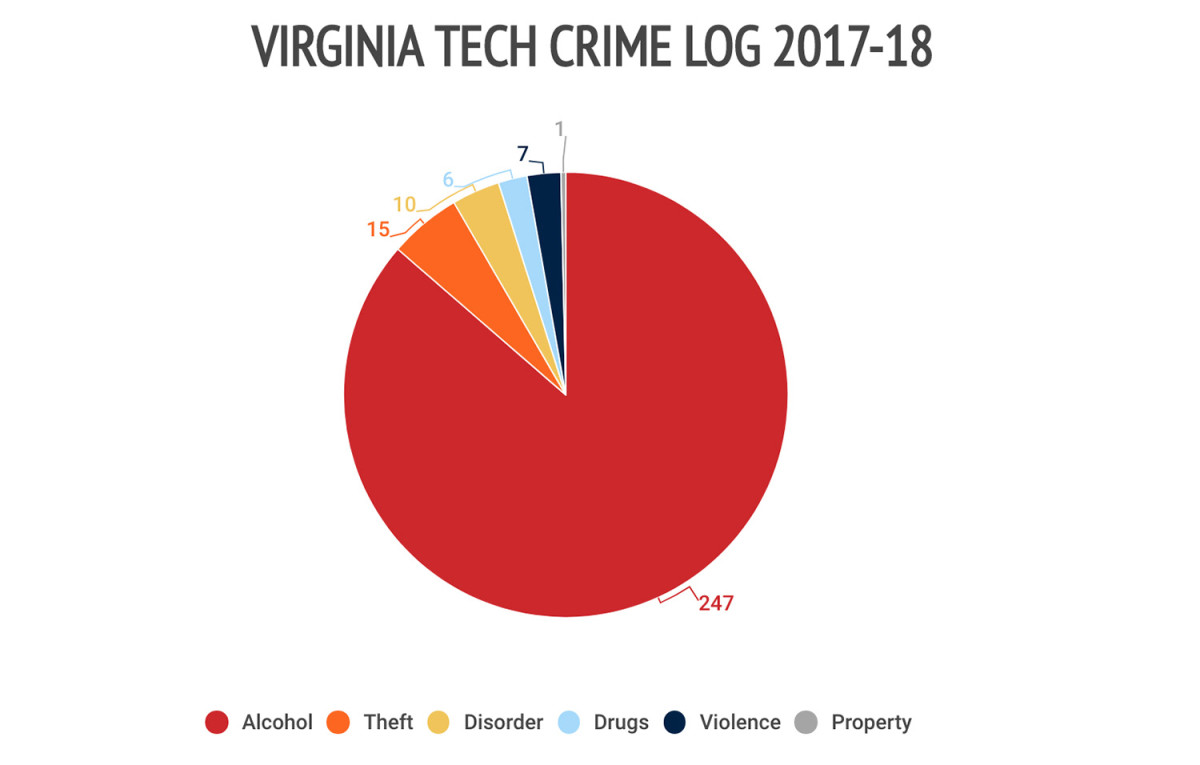
Over six home games, campus police reported 247 alcohol-related incidents, 15 thefts, 10 disorderly incidents, seven violent incidents, six drug-related incidents and one property crime. Underage drinking offenses accounted for 50 (23%) of the alcohol-related incidents. Two of the violent offenses were sexual assaults.
NC State
Incident rate: 0.858
Conference: ACC
Undergraduate student body (2017): 23,847
Average game attendance (2017): 56,850
Location type: City
Number of home games: 6
Total number of police incidents on campus on gamedays: 293
Number incidents per gameday: 48.8
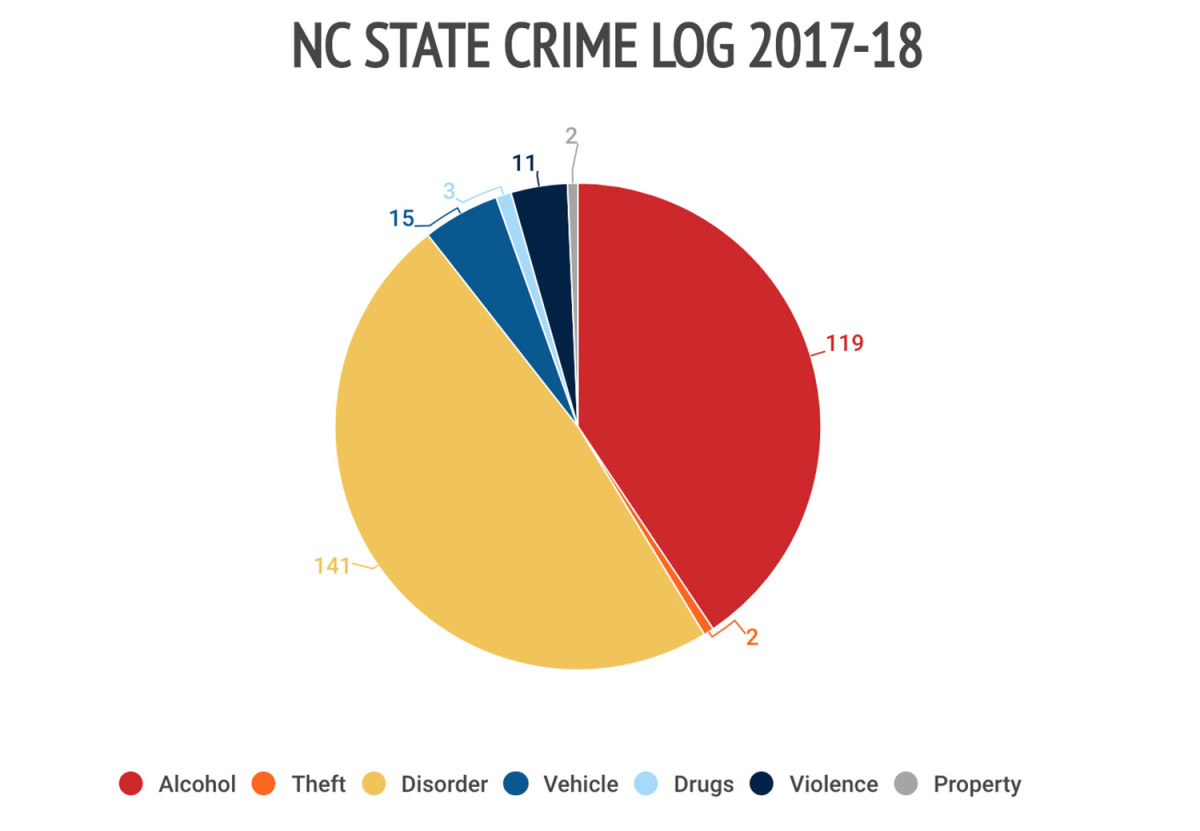
Over six home games, campus police reported 141 disorderly incidents, 119 alcohol-related incidents, 11 violent incidents, 15 vehicle-related incidents, three drug incidents, two thefts and two property crimes. Four of the violent offenses were sexual assaults.
