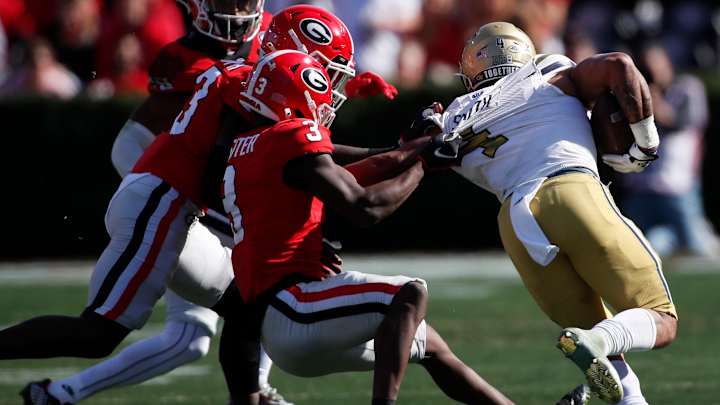
SP+ Predicts Georgia Tech vs Georgia Score

After getting bowl-eligible last Saturday, Georgia Tech now needs to refocus and get ready for the No. 1 team in the country.
Georgia is coming to Atlanta on Saturday on a 28-game winning streak and aiming toward winning a third consecutive national title. After some close games earlier in the year against South Carolina and Auburn, Georgia has found its stride in the last three games against Missouri, Ole Miss, and Tennessee. All three were ranked opponents and Georgia blew out the Rebelse and Volunteers. Quarterback Carson Beck is playing as well as any quarterback in the country, Brock Bowers is getting healthy, and the Bulldogs have arguably the best secondary in the country.
When the odds were released on Sunday, Georgia was unsurprisingly a 24.5-point favorite. Not only do the oddsmakers have the Bulldogs as big favorites, but the analytics do too.

Bill Connelly's SP+ system has Georgia winning by a score of 43-14 and he gives the Bulldogs a 95% chance of beating the Yellow Jackets.
RIVALRY WEEK SP+ PICKS, FOR REAL
— Bill Connelly (@ESPN_BillC) November 20, 2023
Michigan 26, Ohio St 20
Oregon 36, Ore St 25
Bama 32, Auburn 18
EGG 34, BOWL 21 DAMMIT
Mizzou 32, Arkansas 24
Texas 36, Tech 18
LSU 32, A&M 29
UNC 29, NC St 26
UGA 43, GT 14
Iowa 18, Nebraska 11 (MORE LIKE 8-1, RIGHT?)https://t.co/fjsWyQPXfP pic.twitter.com/agSg6ZBP1P
So what exactly is SP+ and what goes into making these rankings? Here is how Connelly formulates his rankings in his own words:
"I base SP+ projections on three primary factors, weighted by their predictiveness:
1. Returning production. The returning production numbers are based on rosters I have updated as much as possible to account for transfers and attrition. The combination of last year's SP+ ratings and adjustments based on returning production make up about half of the projections formula
2. Recent recruiting. This piece informs us of the caliber of a team's potential replacements (and/or new stars) in the lineup. It is determined by the past few years of recruiting rankings in diminishing order (meaning the most recent class carries the most weight). Beginning this season, I am also incorporating transfers -- both the quality and the volume -- in a different way. After last season's transfer-heavy recruiting shift, I've got a bit more data for how to handle that. This piece makes up about one-third of the projections formula.
3. Recent history. Using a sliver of information from previous seasons (two to four years ago) gives us a good measure of overall program health. It stands to reason that a team that has played well for one year is less likely to duplicate that effort than a team that has been good for years on end (and vice versa), right? This is a minor piece of the puzzle -- only about 15% -- but the projections are better with it than without.
I will update these numbers in May and August, after further transfers and roster changes have come about (and after I've had a bit more time to tinker with handling transfers and other factors). But for now, let's look at what SP+ has to say about the college football landscape.
A reminder on SP+: It's a tempo- and opponent-adjusted measure of college football efficiency. It is a predictive measure of the most sustainable and predictable aspects of football, not a résumé ranking, and, along those same lines, these projections aren't intended to be a guess at what the AP Top 25 will look like at the end of the year. These are simply early offseason power rankings based on the information we have been able to gather to date."
Kirby Smart Praises the Job Brent Key has Done at Georgia Tech: "They've won games because they're playing good football"
Follow us on social media for the latest news on Georgia Tech Athletics!
Facebook: All Yellow Jacket
Twitter: @AllYellowJacket
