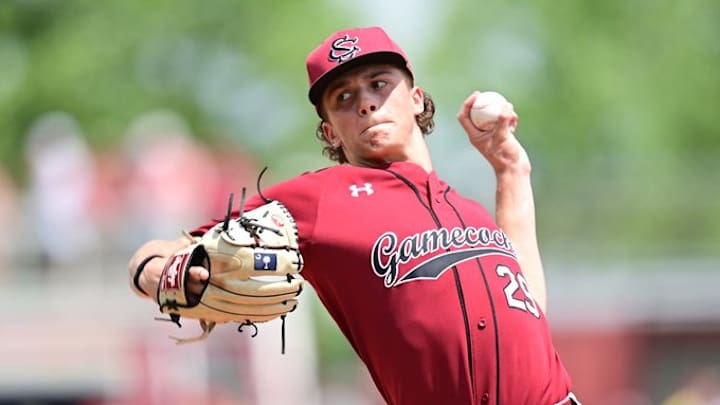
A Statistical Guide To South Carolina's Regional

For the second time in the past three years, Mark Kingston and South Carolina's Baseball team are hosting a regional in Founders Park. In 2021, things didn't end the way Gamecock Nation would've liked, as the Virginia Cavaliers wound up making it out of Columbia and all the way to the College World Series.
This time around, the Gamecocks have a regional grouping that, while not too daunting, shouldn't be underestimated either. To gauge how these teams setup in this Regional grouping, I took key statistics relative to pitching, batting, and fielding, as well-rounded play will be required to move onto the Super Regionals. The stats I used were as follows:
- ERA | Runs allowed on average versus Quad 1 Opponents
- Fielding Percentage
- Strikeout-to-walk Ratio (Pitching)
- Strikeout-to-walk Ratio (Batting)
- Batting Average on Balls in Play (BABIP | Method used to measure luck)
- Secondary Average (Calculated on bases earned through power (extra-base hits) + plate discipline (walks) + speed (stolen bases))
Now here's how each of the four teams stacked up against one another in the aforementioned statistical categories.
Team ERA | Runs allowed on average versus Quad 1 Teams
South Carolina: 4.20
- Runs allowed on average versus Quad 1 Teams (33 games): 5.30
Campbell: 4.53
- Runs allowed on average versus Quad 1 Teams (14 games): 6.64
NC State: 4.37
- Runs allowed on average versus Quad 1 Teams (26 games): 6.33
Central Connecticut: 5.02
- Runs allowed on average versus Quad 1 Teams (4 games): 13.5
Fielding Percentage
South Carolina: 97.3%
Campbell: 96.6%
NC State: 97.5%
Central Connecticut: 97%
Strikeout-to-Walk Ratio (Pitching)
South Carolina: 2.88
Campbell: 2.05
NC State: 2.74
Central Connecticut: 1.73
Strikeout-to-Walk Ratio (Batting)
South Carolina: 1.65
Campbell: 1.49
NC State: 1.37
Central Connecticut: 1.43
BABIP
South Carolina: .326
Campbell: .365
NC State: .328
Central Connecticut: .338
Secondary Average
South Carolina: .439
Campbell: .466
NC State: .375
Central Connecticut: .322
In spite of their recent slump, the Gamecocks statistically come out as the most balanced team across, and seem to have a particular edge when it comes to their pitching. In terms of the rest of the group, while NC State looks to hold a pitching advantage over Campbell and Central Connecticut, it's the Camels who seem to posses the strongest ability to light up the scoreboard.
The Gamecocks will begin regional play against the No. 4 seed Blue Devils of Central Connecticut on Friday night at 7 pm ET on SEC Network Plus.
You Might Also Like:
- Gamecocks Extend Losing Streak to Five, Drop Game One To Arkansas
- Takeaways From The Gamecocks' Midweek Loss To North Florida
- Gamecocks In Search Of Answers After Being Swept By Kentucky
Join the community:
- Follow Andrew Lyon on Twitter: @ALyon_SC
- Follow Christian Dart on Twitter: @ChristianJDart
- Follow Fisher Brewer on Twitter: @USCTalk
- Follow Arvon Bacon on Twitter: @baconnetworkllc
- Follow Locked On Gamecocks on Youtube or wherever you get your podcasts
You can follow us for future coverage by clicking "Follow" on the top right-hand corner of the page. Also, be sure to like us on Facebook @GamecocksDigest & follow us on Twitter at @GamecocksDigest.
