College football strength of schedule rankings for 2023: SEC, Big Ten lead the way

Quality of schedule is more important now than ever before as the College Football Playoff puts a lot of weight onto who teams play before deciding to include them in the rankings or the semifinal tournament.
Which leaves the question: how do you determine a quality schedule? One way is to simply count up the wins and losses of your opponents from the season before.
The method is far from perfect, though: the new transfer portal, changes in recruiting fortunes, and just the loss of players owing to their exhausting eligibility or by graduating all mean that programs are doing major surgery to their rosters just about every offseason.
Plus, there are just the changes that teams organically go through every year as their fortunes improve or worsen from year to year.
Moreover, not all wins are created equally, meaning that a team can play an opponent with fewer overall wins but against quality opposition, while another team can play a school with more wins but against substandard competition.
All that said, at this stage of the offseason with no actual tape to watch of teams in their current form, adding up the Ws and the Ls for each team on the schedule is simply the best we can do with the information we actually have.
College Football Strength of Schedule Rankings for 2023 Season

133. Ohio — 58-89 (39.5%)
132. New Mexico State — 62-94 (39.7%)
131. Temple — 62-88 (41.3%)
130. Charlotte — 63-86 (42.3%)
129. Memphis — 65-87 (42.8%)
128. Air Force — 63-83 (43.2%)
127. Fresno State — 65-85 (43.3%)
126. Eastern Michigan — 64-82 (43.8%)
125. UConn — 65-82 (44.2%)
124. New Mexico — 67-84 (44.4%)
123. Hawaii — 71-89 (44.4%)
121. Northern Illinois — 66-82 (44.6%)
121. Toledo — 66-82 (44.6%)
120. Akron — 68-82 (45.3%)
119. Navy — 69-82 (45.7%)
118. Liberty — 67-79 (45.9%)
117. Miami (OH) — 69-81 (46.0%)
116. SMU — 70-82 (46.1%)
115. Louisville — 67-78 (46.2%)
114. Nevada — 71-82 (46.4%)
113. Washington State — 69-79 (46.6%)
112. Wyoming — 71-80 (47.0%)
111. UNLV — 71-79 (47.3%)
110. Colorado State — 72-80 (47.4%)
109. Iowa — 72-79 (47.7%)
108. Georgia Southern — 70-76 (47.9%)
107. Tulsa — 73-79 (48.0%)

106. Nebraska — 74-79 (48.4%)
105. Marshall — 71-75 (48.6%)
104. TCU — 74-78 (48.7%)
103. Miami (FL) — 73-76 (49.0%)
102. Coastal Carolina — 71-73 (49.3%)
97. ULM — 74-76 (49.3%)
97. Louisiana — 74-76 (49.3%)
97. USC — 74-76 (49.3%)
97. Utah State — 74-76 (49.3%)
97. North Texas — 74-76 (49.3%)
96. Oregon — 75-77 (49.3%)
95. Kent State — 76-78 (49.4%)
94. MTSU — 72-73 (49.7%)
93. Maryland — 73-73 (50.0%)
90. Ball State — 77-76 (50.3%)
90. Wisconsin — 77-76 (50.3%)
90. UTSA — 77-76 (50.3%)

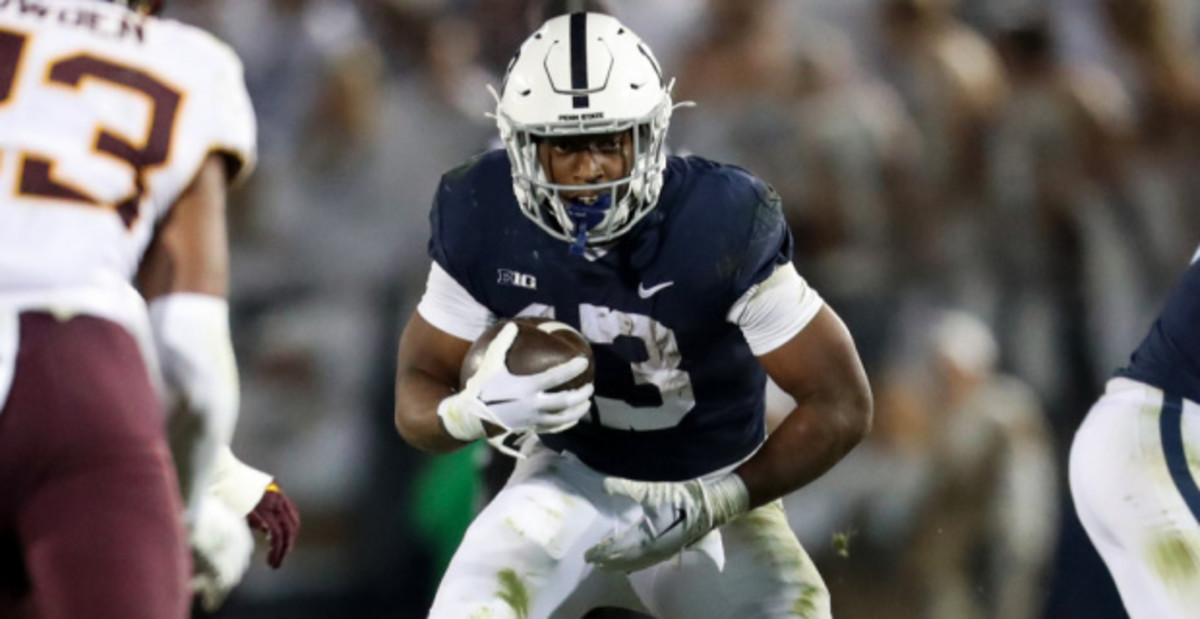
89. Penn State — 76-75 (50.3%)
88. Rutgers — 75-74 (50.3%)
85. Arkansas State — 77-75 (50.7%)
86. Bowling Green — 77-75 (50.7%)
85. FIU — 76-72 (51.4%)
83. Troy — 77-72 (51.7%)
83. James Madison — 77-72 (51.7%)
82. UTEP — 76-71 (51.7%)
81. Western Kentucky — 75-70 (51.7%)
80. Illinois — 80-74 (51.9%)
78. Florida State — 79-73 (52.0%)
78. Rice — 79-73 (52.0%)
76. Louisiana Tech — 77-70 (52.4%)
76. Boston College — 77-70 (52.4%)
73. San Diego State — 81-73 (52.6%)
73. Buffalo — 81-73 (52.6%)
73. Cincinnati — 81-73 (52.6%)
71. UCLA — 80-72 (52.6%)
71. USF — 80-72 (52.6%)
70. Jacksonville State — 78-70 (52.7%)
67. UMass — 80-71 (53.0%)
67. Virginia Tech — 80-71 (53.0%)
67. Syracuse — 80-71 (53.0%)
66. Appalachian State — 81-71 (53.3%)

63. Georgia — 80-70 (53.3%)
63. LSU — 80-70 (53.3%)
63. Oregon State — 80-70 (53.3%)
62. Old Dominion — 79-69 (53.4%)
61. Tulane — 83-71 (53.9%)
60. Arizona — 82-70 (53.9%)
59. NC State — 81-69 (54.0%)
57. Oklahoma — 84-71 (54.2%)
57. UAB — 84-71 (54.2%)
54. Washington — 83-70 (54.2%)
54. Central Michigan — 83-70 (54.2%)
54. Oklahoma State — 83-70 (54.2%)
53. San Jose State — 85-71 (54.5%)
52. Kansas — 84-70 (54.5%)
51. Michigan — 83-69 (54.6%)
49. Arkansas — 83-68 (55.0%)
49. Pittsburgh — 83-68 (55.0%)
48. Western Michigan — 85-69 (55.2%)
47. BYU — 83-67 (55.3%)
46. FAU — 86-69 (55.5%)
45. Purdue — 85-68 (55.6%)
44. Southern Miss — 84-67 (55.6%)
41. Vanderbilt — 86-68 (55.8%)
41. Boise State — 86-68 (55.8%)
40. South Alabama — 85-67 (55.9%)
39. Sam Houston State — 84-66 (56.0%)
37. Utah — 86-67 (56.2%)
37. Georgia Tech — 86-67 (56.2%)
35. Georgia State — 85-66 (56.3%)

35. Clemson — 85-66 (56.3%)
34. East Carolina — 87-67 (56.5%)
31. Alabama — 86-66 (56.6%)
31. Northwestern — 86-66 (56.6%)
31. Duke — 86-66 (56.6%)
29. Texas State — 88-67 (56.8%)
29. Colorado — 88-67 (56.8%)
27. Mississippi State — 87-66 (56.9%)
27. Indiana — 87-66 (56.9%)
26. North Carolina — 85-64 (57.0%)
25. Minnesota — 89-67 (57.1%)
24. Army — 88-65 (57.5%)
22. Texas A&M — 87-64 (57.6%)
22. Wake Forest — 87-64 (57.6%)
21. Texas — 92-66 (58.2%)
20. Arizona State — 90-64 (58.4%)
19. Virginia — 88-62 (58.7%)
18. Notre Dame — 90-63 (58.8%)
17. Baylor — 92-64 (59.0%)
16. Tennessee — 90-62 (59.2%)
15. Stanford — 92-62 (59.7%)
14. Texas Tech — 94-63 (59.9%)

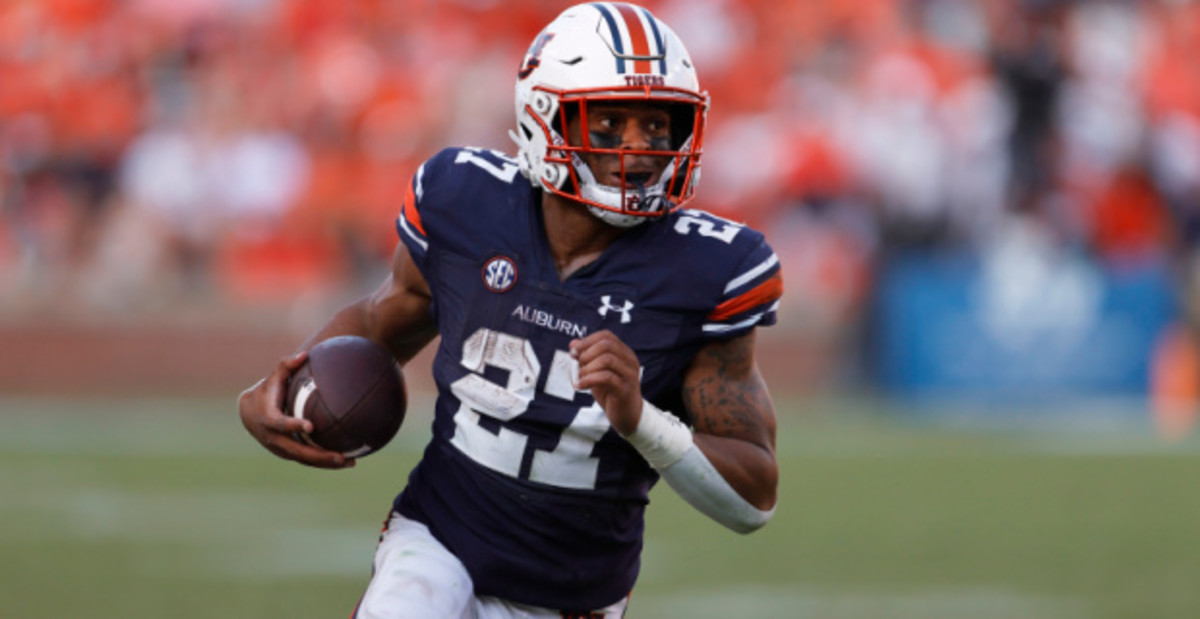
12. Auburn — 93-62 (60.0%)
12. Cal — 93-62 (60.0%)
11. Kentucky — 93-61 (60.4%)
10. Kansas State —96-62 (60.8%)
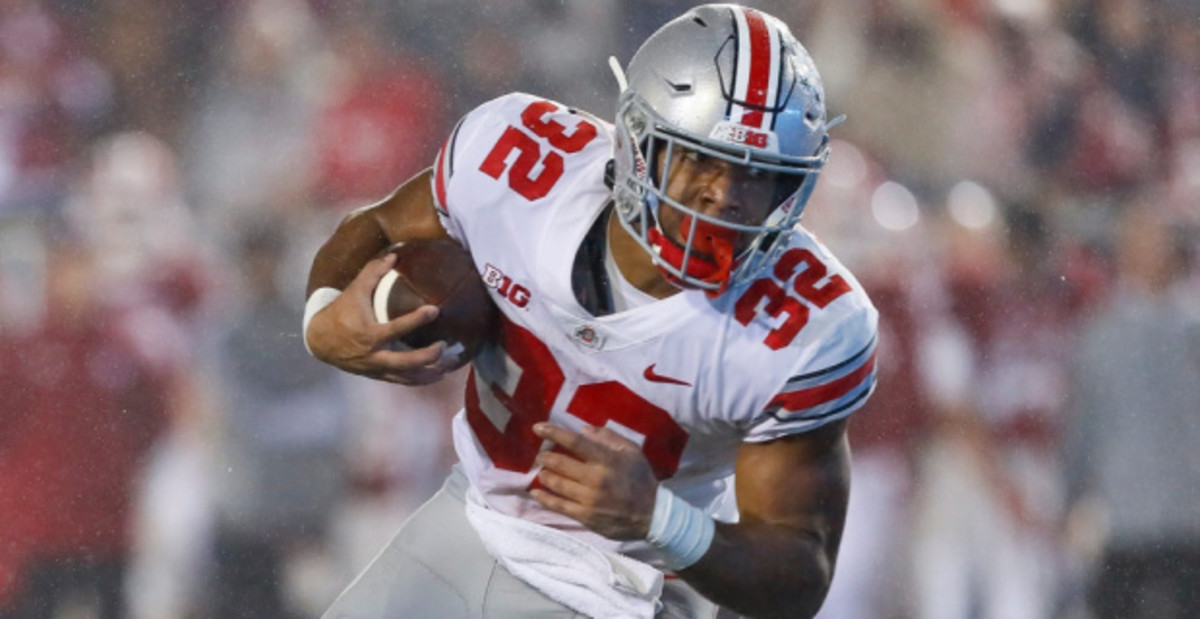
9. Ohio State — 94-60 (61.0%)
8. Iowa State — 97-61 (61.4%)
6. Florida — 96-60 (61.5%)
6. Houston — 96-60 (61.5%)
5. Missouri — 97-60 (61.8%)
4. Ole Miss — 95-58 (62.1%)
3. West Virginia — 98-59 (62.4%)
2. Michigan State — 96-57 (62.7%)
1. South Carolina — 103-53 (66.0%)
More college football from SI: Top 25 Rankings | Schedule | All Teams
