Why Marlins' success likely won't last

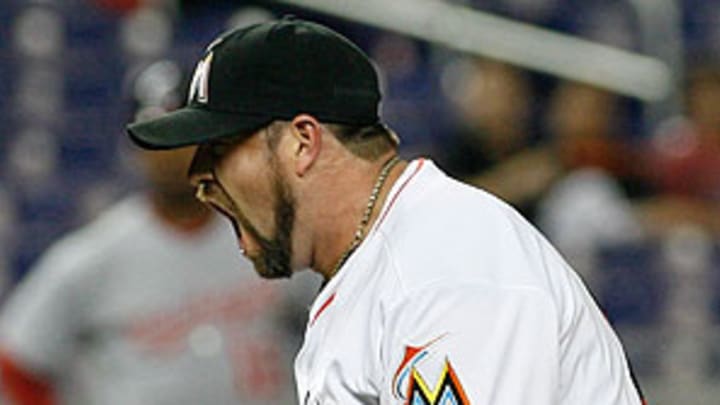
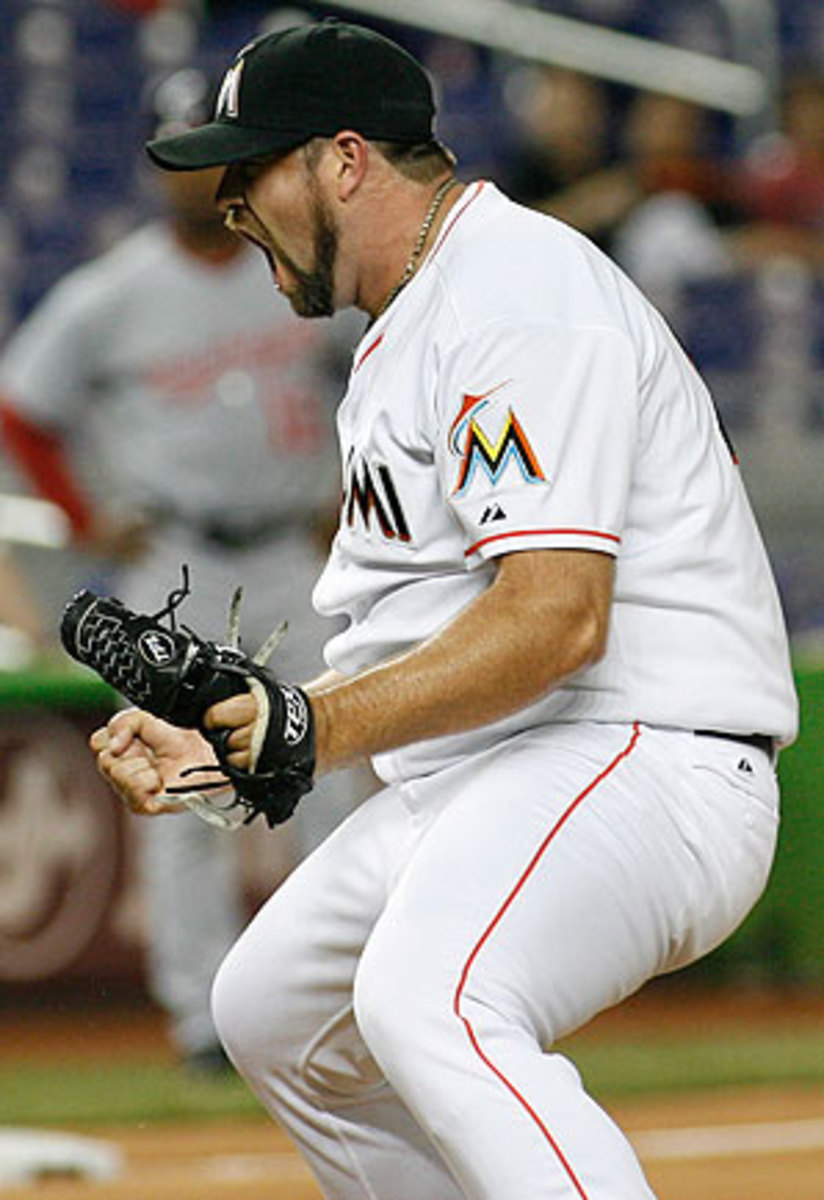
After a horrendous April, Heath Bell and the Marlins have had something to shout about in May. (AP)

The Marlins began the season in April with the fanfare of a new ballpark, new uniforms, a garish home run sculpture and batch of marquee additions, but when manager Ozzie Guillen's remarks about Fidel Castro struck a nerve both in Miami and inside the commissioner's office, things quickly went south. The Marlins were just 8-14, mired in last place in the NL East when the calendar turned to May, but they reeled off a seven-game winning streak in the first week of the month, and thanks to a recent 8-3 run, their record this month is a major league best 21-8, for a .724 winning percentage. Via a just-completed three-game sweep of the Nationals, they're now second in the division, one-half game behind Washington. If the season ended today, they'd host the Mets in the Wild Card game.
Don't start printing playoff tickets just yet, though. Though the Marlins are seven games above .500 at 29-22, they've outscored opponents by only two runs, for a Pythagorean winning percentage of .505; in other words, they're about three wins above expectations, the type of showing that tends to regress over the course of the season. During their 21-8 run, they've outscored opponents 131-115, a balance that would be expected to produce a .559 winning percentage, or 16.2 wins in 29 games. In other words, they've been playing way over their heads lately.
They've done so by winning the close ones, going 11-8 in one-run games, 7-3 in two-run games, and 2-5 in games decided by five runs or more. At 18-11 in games decided by two runs or less, their .621 winning percentage is fourth in the majors, and second in the league behind the Mets (16-6, .727). Their 29 close games is tied for third behind the Giants and Tigers at 30.
Again, such performances generally aren't sustainable over the course of a full season. Last year, three teams finished with winning percentages above .600 in games decided by two runs or less, which was as many as the previous twoseasons combined. From 2000 through 2011, just 21 teams have done so, around two per year. Such a frequency of close games generally won't last, either. The Marlins are on pace to play 92 such games, which would rank as the fourth-highest total since 2000. The record is held by Guillen's world champion 2005 White Sox, who played 95 squeakers and went 61-34 (.642) in those games. Oddly enough, all five of the other teams who played at least 90 close games in a season had records below .500 in those games.
Sustaining such success in close games is hard because it usually comes down to clutch performances. Teams outdo their expected winning percentages (in terms of runs scored and runs allowed) by hitting or pitching especially well with runners on base or in scoring position, or in the tightest games — what are generally referred to as high-leverage situations. For decades, sabermetricians have sought proof of the existence of clutch hitters — players who routinely rise to the occasion and perform better — and while anecdotally, fans tend to remember the big hits by the likes of David Ortiz and Derek Jeter, nobody, not even Bill James, has proven their existence to the satisfaction of the general stathead community. That's not to say that clutch hits don't exist — they happen every day — it's just that predicting who will be clutch is something of a fool's errand. The best players tend to hit the best, regardless of the circumstances.
Clutch pitching is a bit of a different story, because managers have more control over how they deploy their relievers, particularly their best ones. They can bring them in to face the top hitters, whereas managers usually don't have a pinch-hitter better than their other hitters waiting in reserve, and they can't alter the order in which their players bat in big situations. Additionally, top closers such as Mariano Rivera tend to allow fewer hits on balls in play, seemingly in defiance of what we've learned over the past decade about the extent to which pitchers can control such outcomes.
So how are the Marlins doing it? Not with the wood in their hands; their batters are hitting a meager .233/.333/.344 with runners in scoring position, which in term of OPS ranks 11th, and is neither as good as their overall .246/.316/.381 line nor the NL average with runners in scoring position of .243/.334/.382. In high leverage situations, the Marlins are batting .249/.332/.398, which isn't significantly better than the league average of .254/.331/.392; their 730 OPS ranks eighth.
To the extent that one can put a finger on it, those close wins owe more to the pitching staff. Marlins pitchers have yielded a .232/.339/.334 line with runners in scoring position, compared to the NL average of .246/.337/.385; that resulting 673 OPS ranks fifth in the league, while the five home runs they've yielded are tied for second. On the other hand, in high leverage situations — the ones that have the greatest impact upon win expectancy, which generally arrive in the late innings when the number of outs is dwindling — they've yielded a .262/.339/.382 line, very close to to the NL average of .255/.331/.392; that resultant 722 OPS ranks 10th in the league.
Another way of looking at pitching performance under such circumstances is through Baseball Prospectus' Fair Run Average stat. FRA expresses the number of runs allowed per nine innings after dividing up the responsibility when a pitcher departs with men on base by taking into account the run expectancy of the situation, the expected yield given the number of outs and the location of baserunners. It does away with the distinction between earned and unearned runs — scaling about nine percent higher than ERA, pegged to the league scoring rate — and adjusts for the quality of defensive support received. Furthermore, it credits the pitcher’s sequencing (a walk issued with the bases empty is less costly than one with the bases loaded) and his ability to get groundballs and infield popups, which come in handier with men on base.
Via Fair Run Average, the Marlins starters rank fifth in the league, at 4.12 runs per nine, about half a run behind the league-leading Nationals at 3.65. Miami's bullpen also ranks fifth, at 3.65 runs per nine, but that's only about one-quarter of a run behind the Reds' 3.41 per nine, and 0.03 behind the two teams in a virtual tie for second-best in the league, the Nationals and Pirates.
