Incredible numbers of the incomparable Mariano Rivera

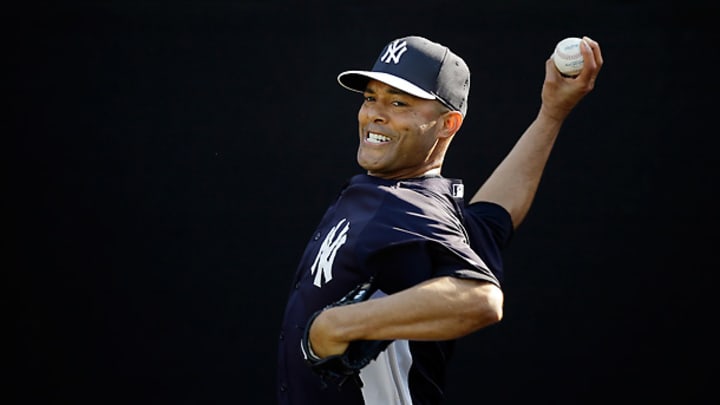
In 18 seasons, Mariano Rivera has thrown 13 wild pitches and only four in his last 10 seasons. [Matt Slocum/AP]
![In 18 big league seasons, Mariano Rivera has thrown 13 wild pitches and only four in his last ten seasons. [Matt Slocum/AP]](https://www.si.com/.image/t_share/MTY4MjU5MDQ3NDI5Nzc3Mjgx/image-placeholder-title.jpg)
By Cliff Corcoran
Mariano Rivera’s intention to retire after the coming season is “an open secret” according to ESPN’s Buster Olney, one Olney expects Rivera will make official as soon as this weekend. That announcement will signal the end of one of the greatest careers in baseball history. Rivera’s unchallenged status as the greatest closer in the history of baseball and the universal respect and admiration he has engendered throughout the game is as unique as his combination of consistency, longevity and sheer dominance on the mound.
Part of what makes Rivera such a unifying figure is just how clearly he has dominated his field. His position as the game's career saves leader is common knowledge, but what’s most remarkable about his 608 saves is that they are 27 percent more than the third man on the all-time list (Lee Smith), 43 percent more than the man in fourth-place (John Franco) and more than twice as many as the next man on the active leader list. Looking at that list, Jonathan Papelbon is the only closer who would seem to have even the slimmest chance to catch Rivera, and he's 32 and would need another 351 saves to tie Rivera -- 10 more than Hall of Famer Rollie Fingers' career total.
What has made Rivera great, however, is not just his ability to accumulate saves. It's how consistently dominant he was in his 16 full seasons in the major leagues prior to last year’s season-ending knee injury. His saves record points to that -- only twice did Rivera save more than 45 games, but he shares with Trevor Hoffman the record for most seasons with 30 or more at 14 (Smith is next with 10)--but that’s only a small part of the evidence.
More telling than his saves is Rivera’s lead in adjusted ERA. With a mark of 206, Rivera is the all time leader in ERA+ among pitchers with 1,000 or more innings pitched. Second place is Pedro Martinez at 154 (with 100 being average). Yes, he accomplished that as a short reliever, but there are no other short relievers with career marks anywhere near his. Hoyt Wilhelm is closest at 147 followed by Dan Quisenberry at 146.
Rivera’s run prevention is even more remarkable when you look at it season-by-season. In the entire history of baseball, Martinez and the Rangers' Joe Nathan are tied for second place with the most seasons with 60 or more innings pitched and an ERA+ of 200 or better. They have five such seasons each. Rivera has 12. Rivera is also the only pitcher ever to have more than one season with at least 60 innings pitched and an ERA+ of 300 or better, doing so in 2005 and 2008. In fact, Rivera has more seasons with an ERA+ above 200 than below, falling short of that mark just five times in his career, including his rookie season which consisted of just 19 games.
How about this, in his 16 full seasons as a relief pitcher Rivera has averaged the following:
2.02 ERA
225 ERA+
0.97 WHIP
8.3 K/9
1.9 BB/9
4.33 K/BB
0.4 HR/9
That’s a career year for your average closer. Rivera did it for more than a decade and a half while averaging 71 innings and 38 saves a season.
If any of this sound familiar, it’s because I pointed some of the above out when Rivera was on the verge of the saves record in September 2011 (and twice before that per the links in that piece), and I have to swipe my favorite breakdown of Rivera’s numbers from that piece wholesale.
Dominance. Longevity. Consistency. That’s what made Mariano Rivera great, and nothing demonstrates that better, to my eyes, than the following chart, which attempts to locate Rivera’s peak by looking at his performance in overlapping nine-year slices of his career, a span chosen because his primary rivals for the title of greatest relief pitcher ever (Hoffman, Wilhelm and Goose Gossage) each had peaks that lasted exactly nine years. Here are Rivera’s nine-year slices:
Seasons | IP | ERA+ | bWAR |
|---|---|---|---|
1996-2004 | 661 1/3 | 218 | 33.0 |
1997-2005 | 632 | 222 | 31.4 |
1998-2006 | 635 1/3 | 223 | 31.1 |
1999-2007 | 645 1/3 | 210 | 29.9 |
2000-2008 | 647 | 213 | 30.5 |
2001-2009 | 637 2/3 | 225 | 30.7 |
2002-2010 | 617 | 231 | 30.2 |
2003-2011 | 632 1/3 | 238 | 30.4 |
Note that the first and last of those nine-year periods overlap by just one year yet the overall level of performance is largely unchanged, and every one of those slices beats the nine-year peaks of Hoffman, Wilhelm and Gossage.
