Verlander provides vintage performance, but is workload catching up?
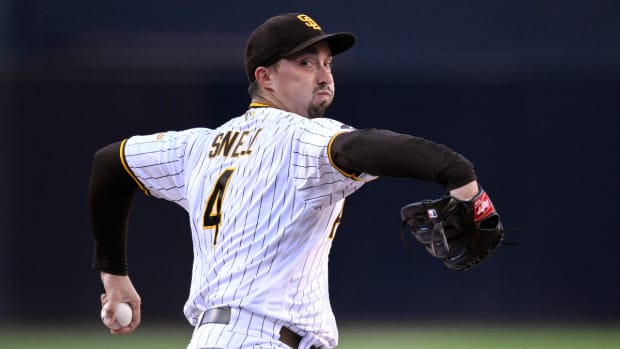
Justin Verlander struck out 13 Pirates on Monday, his season high this year. (AP)

Justin Verlander is the one of the game's elite pitchers, not to mention the highest-paid, but in recent weeks, he'd failed to earn his keep. On Monday, he arrested a three-start skid with a season-high 13 strikeouts in seven strong innings against the Pirates, helping the Tigers to a 6-5 win.
Verlander had failed to last more than five innings in any of his previous three starts, allowing a total of 17 runs (16 earned) in 12 2/3 innings against the Indians on May 11 and May 22, and the Rangers on May 16. He was off in all three, walking five in five innings in the first of those games, getting tagged for eight runs in 2 2/3 innings in the second, and yielding 10 hits and five runs in the third, in which he returned to the mound after a 62-minute rain delay, ostensibly so he could be credited with a win.
Until that stretch, the 30-year-old righty had been humming along with a microscopic 1.55 ERA despite diminished fastball velocity, aided by the fact that six of his first seven starts came against teams that rank in the bottom half of the league in scoring. The outings against the Indians and Rangers, both in the league's upper half in scoring, added more than two full runs to his ERA, which now sits at 3.68.
The Pirates, scraping by at 3.96 runs per game and one of the league's more strikeout-prone teams, made for easier prey. Through the first six innings of Sunday's game, they collected only four hits and one first-inning run, but in the seventh — the only inning in which Verlander threw more than 18 pitches — they added a pair via three extra-base hits.
According to the PITCHf/x data at BrooksBaseball.net Verlander averaged 94.5 mph with his four-seam fastball — a bit higher than his year-to-date average of 93.2, and approaching last year's mark of 95.1. Only one of Sunday's swings and misses came against the heater, however, and his rate on such pitches has dropped from 10.2 percent last year to 7.6 percent this year. He has compensated by getting more swings and misses with his curve (14.5 percent, up from 9.3 percent), though on Sunday, his changeup and slider were the ones the Bucs missed most. Verlander generated seven swings and misses with the former, six with the latter, compared to just three with the curve. Here's a montage of his strikeouts:
[mlbvideo id="27493511" width="480" height="270" /]
While Verlander's current ERA is uncharacteristic of his recent work — a 2.52 mark over the past two years — and that's more a product of his elevated batting average on balls in play than of the areas over which he has more control. His .368 BABIP is the league's third-highest among qualifiers, behind only Joe Blanton (.395) and Wade Davis (.392), and a whopping 112 points above his 2011-2012 mark. His walk rate is elevated as well, such that he's had far more baserunners to deal with, and has thrown from the stretch more often; his WHIP is 38 percent higher than his 2011-2012 peak. Even so, his strikeout and home run rates have both moved in the right directions. Here are his peripherals on a per plate appearance basis, which accounts for the extra volume of hitters he's faced this year:
Years | HR | BB | SO | BABIP | FIP | ERA |
2011-2012 | 2.2% | 6.1% | 25.4% | .256 | 2.97 | 2.52 |
2013 | 1.1% | 8.1% | 29.0% | .368 | 2.35 | 3.68 |
Via his Fielding Independent Pitching, which is based on his strikeout, walk, hit-by-pitch and home run rates, he's actually been better than in 2011-2012; it's his defensive support that's been lacking.The Tigers rank third-to-last in the league in defensive efficiency at .674, 17 points below the league average, a consequence of an infield defense that includes Miguel Cabrera and Prince Fielder at the corners. Last year, the Tigers were second-to-last in defensive efficiency at .678, 16 points below the league average.
It's worth considering whether Verlander's BABIP has been elevated as a result of generating more hard contact, a possibility given his reduced velocity. His line drive rate is up only slightly, from 22.2 percent last year to 23.7 percent this year according to the data at FanGraphs, but it's up from 19.9 percent over the 2011-2012 span. That said, the distinction between line drives, fly balls and grounders is a subjective one made by a stringer, one that often hinges on whether a ball lands for a hit. Also worth noting is his elevated groundball rate: 44.6 percent, up from 41.3 percent over the two year span — which has helped keep his home run rate lower.
One other factor in Verlander's reduced velocity may be his workload. He's led the AL in innings pitched in three of the past four seasons, and over the previous two, has thrown 489 1/3 innings, 12 1/3 more than any other pitcher — and that's not including the 48 2/3 he's added in the postseason. Particularly given the shorter offseasons to recuperate, the mileage may be catching up, and it's worth recalling that he opted out of the World Baseball Classic earlier this spring because of shoulder soreness and a delay in ramping up his throwing program.