%20%20--%3E%0A%3Csvg%20version%3D%221.1%22%20id%3D%22Layer_1%22%20xmlns%3D%22http%3A%2F%2Fwww.w3.org%2F2000%2Fsvg%22%20xmlns%3Axlink%3D%22http%3A%2F%2Fwww.w3.org%2F1999%2Fxlink%22%20x%3D%220px%22%20y%3D%220px%22%0A%09%20width%3D%2239px%22%20height%3D%2240px%22%20viewBox%3D%220%200%2039%2040%22%20enable-background%3D%22new%200%200%2039%2040%22%20xml%3Aspace%3D%22preserve%22%3E%0A%3Cpath%20fill%3D%22%23FFFFFF%22%20d%3D%22M38.5%2C7H28.2v26h10.3V7z%22%2F%3E%0A%3Cpath%20fill-rule%3D%22evenodd%22%20clip-rule%3D%22evenodd%22%20fill%3D%22%23FFFFFF%22%20d%3D%22M26.1%2C25.5c0%2C5.8-4.1%2C7.5-12.9%2C7.5C3.9%2C33%2C0%2C31.2%2C0%2C25.2v-1.1h11.6%0A%09v2.4c0%2C0.7%2C0.1%2C1.4%2C1.2%2C1.4c1%2C0%2C1.2-0.4%2C1.2-1.3v-0.9c0-1.6-0.9-1.6-3.5-2.2C2.2%2C21.7%2C0%2C19.7%2C0%2C15.3v-0.9C0%2C9.3%2C5.5%2C7%2C12.9%2C7%0A%09c10.2%2C0%2C12.8%2C2.6%2C12.8%2C7.4v1.8h-11v-2.9c0-0.6-0.4-1.1-1.2-1.1c-0.6%2C0-1.2%2C0.4-1.2%2C1.1v0.9c0%2C1.5%2C0.9%2C2%2C3.3%2C2.5%0A%09c8%2C1.6%2C10.5%2C3.3%2C10.5%2C7.5V25.5z%22%2F%3E%0A%3C%2Fsvg%3E%0A)
Average payrolls of playoff teams shows money not the factor it used to be

Despite always having one of the game's smallest payrolls, the A's have made seven postseason appearances in the past 14 years. (Jeff Chiu/AP)
If it seems as though the presence of teams like the Pirates, A's and Rays in the postseason — not to mention the absence of the Yankees — heralds a change in the extent to which payroll drives success, it's hardly an illusion. For the past decade, the average payroll ranking of postseason teams as well as the ratio of those payrolls to the major league average have both fallen sharply. In fact, this year's 10-team field reflects the most level one of the wild-card era in terms of payroll.
Call it a victory for competitive balance, or at least for the revenue sharing and luxury tax provisions put into place over the past two decades on Commissioner Bud Selig's watch, but don't ignore the impacts of strong scouting and analytics in developing more efficient approaches. For the second year in a row, half of the playoff teams rank in the bottom half of the majors in terms of Opening Day payrolls:
2012 | Payroll ($M) | MLB Rank |
| 2013 | Payroll ($M) | MLB Rank |
|---|---|---|---|---|---|---|
Yankees | $198.0 | 1 | $216.6 | 2 | ||
$132.3 | 5 | $150.7 | 4 | |||
$120.5 | 6 | Tigers | $148.4 | 5 | ||
$117.6 | 8 | $115.2 | 11 | |||
Cardinals | $110.3 | 9 | $107.5 | 13 | ||
$83.3 | 16 | Braves | $89.8 | 16 | ||
Reds | $82.2 | 17 | Pirates | $79.6 | 20 | |
$81.4 | 19 | $77.8 | 21 | |||
$81.3 | 20 | $60.7 | 27 | |||
Athletics | $55.4 | 29 | Rays | $57.9 | 28 | |
Avg. | $106.2 | 13.0 | Avg. | $110.4 | 14.7 |
The average ranking of the 10 postseason teams is 14.7, an all-time low (as in higher numbers, lower ranking) -- right at the middle of the pack, Meanwhile the average of those payrolls is just 6.8 percent above the average for all 30 teams.
That's the result of a study I've done using the Opening Day payrolls available from the USA Today Salary Database. While those payrolls don't reflect earned incentive clauses or midseason player movement -- which generally increases contending teams' payrolls -- they form a useful snapshot for year-to-year comparison purposes.
Here's a table showing the average payroll ranking of playoff teams since 1995, the start of the wild-card era. The peak score indicates a higher concentration of big-spending teams in the playoffs:
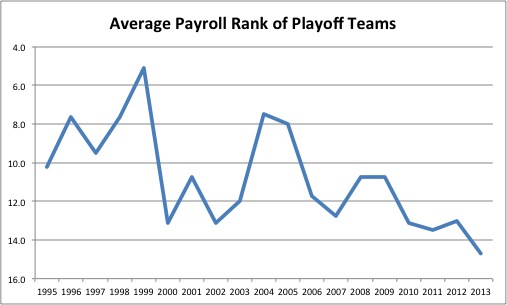
The graph isn't smooth, but the trend since 2004, when the average ranking was 7.5, has been particularly consistent to the point where that ranking has nearly doubled. In 2004, seven of the eight playoff teams ranked among the majors' top dozen in payroll. In 2005, seven of the eight teams were in the top 13, the eighth ranked 16th and the average ranking was 8.0:
2004 | Payroll ($M) | MLB Rank |
| 2005 | Payroll ($M) | MLB Rank |
|---|---|---|---|---|---|---|
Yankees | $184.2 | 1 | Yankees | $208.3 | 1 | |
Red Sox | $127.3 | 2 | Red Sox | $123.5 | 2 | |
$100.5 | 3 | Angels | $97.7 | 4 | ||
Dodgers | $92.9 | 6 | Cardinals | $92.1 | 6 | |
Braves | $90.2 | 8 | Braves | $86.5 | 10 | |
Cardinals | $83.2 | 9 | $76.8 | 12 | ||
Astros | $75.4 | 12 | $75.2 | 13 | ||
$53.6 | 19 | $63.3 | 16 | |||
Avg | $100.9 | 7.5 | Avg | $102.9 | 8.0 |
For sheer concentration of high-payroll teams making the playoffs, nothing beats 1999, when the top six teams in payroll made the playoffs, the entire field of eight came from among the top 11 teams and the average ranking was 5.1.
Since 2004-2005, the average ranking of playoff teams has fallen. It's been at or above 10.8 every year, and at or above 12.8 in five years, including the last four consecutively.
Of course, the expanded playoff field via the addition of an extra wild card in each league has something to do with that, since the larger sample of teams is likely to be more reflective of the league as a whole. Still, even if you omit the losing teams from the Wild-Card games the past two seasons, the trend remains; the average ranking of last year's field with all 10 teams is 13.0, while with eight, it's 13.5. With wins by the Rays and Pirates in last week's Wild-Card games, the final eight teams have an average ranking of 14.1, still an all-time low.
A look at the ratio of the playoff field's payrolls to the MLB average follows a very similar trajectory to the previous chart:
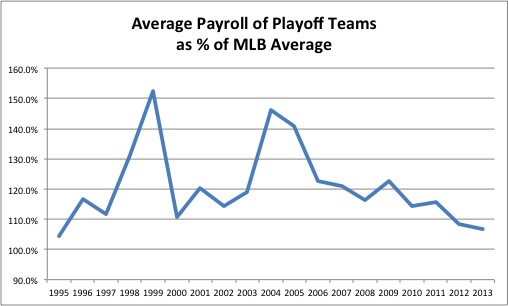
In 2004-2005, the über-rich playoff field had payrolls more than 40 percent above average, but from 2006-2011, that fell to 15-20 percent above average, and the past two years, it's been less than 10 percent above average for the first time since 1995. Winnowing the field to eight teams for the past two years takes those percentages a bit higher -- to 9.5 percent instead of 8.4 percent last year, and to 11.1 percent instead of 6.8 percent this year — but still lower than at any time from 1996-2011. In absolute terms instead of relative ones, the average payroll for playoff teams has ranged between $95.1 million and $110.4 million over the past decade even while the average MLB payroll has risen 49.7 percent, from $69.0 million to $103.3 million.
JAFFE: Pirates' building plan on display during NLDS
Two related factors are playing a part in driving this trend. First, the impact of revenue sharing (introduced in the Collective Bargaining Agreement that was ratified in 1996) redistributed wealth from the big money teams to the smaller ones, while the luxury tax (reinstated in the CBA that was ratified in 2002 after a three-year run from 1997-1999) additionally curbed the top spenders. (Well, it curbed everyone besides the Yankees, who have paid 84.1 percent of all luxury taxes in that period; the Red Sox, by comparison, are second at 6.7 percent).
Second, the Yankees are no longer locks to make the playoffs and appear to be collapsing under the weight of so many expensive long-term deals, not to mention a lesser farm system due to the impact of consistently picking late in each round and often losing draft picks as a penalty for signing Type A free agents. They've ranked atop the majors in payroll every year from 1999 onward but missed the playoffs with payrolls well above $200 million in both 2008 and 2013 — and by the looks of it, they're hardly locks to make it next year as they try to reset their luxury tax rate.
That said, New York's place as payroll behemoths skewing those average rankings and payrolls was supplanted this year by the Dodgers, who became the first non-Yankees team to breach the $200 million payroll barrier and won the NL West, and may well have the game's highest payroll next year if the Yankees can pare down to that $189 million tax threshold.
Other factors are in play as well. The lessons of Oakland's 2000-2003 run of four straight playoff appearances while ranking no higher than 23rd in payroll may have been lost on traditionalists, but the ensuing revolution — traveling under the shorthand moniker of Moneyball, for better or worse — brought an analytic element to virtually every front office. That approach has played a part in the multiple successes of teams as diverse as the Red Sox, Cardinals and Rays, not to mention this year's returns of the Indians and Pirates to the postseason after lengthy absences.
Taking a look at the entire wild-card era, the A's certainly stand out by being among the teams with the most playoff appearances despite their consistently low place in the payroll pecking order:
Team | Playoffs | Avg Rk |
|---|---|---|
Yankees | 17 | 1.1 |
Braves | 14 | 7.3 |
Cardinals | 11 | 10.5 |
Red Sox | 10 | 5.6 |
Indians | 8 | 9.3 |
Athletics | 7 | 26.0 |
Dodgers | 7 | 8.4 |
Here we can get a glimpse of a whole cross-section of approaches. The long runs of the Braves and Cardinals — and yes, even the Yankees — owe much to homegrown player development and the retention of top stars as they've grown expensive; think Tom Glavine, John Smoltz, Andruw Jones and Chipper Jones in Altanta, Albert Pujols in St. Louis and the quintet of Derek Jeter, Andy Pettitte, Jorge Posada, Mariano Rivera and Bernie Williams in the Bronx. Pricey free agents supplemented those long runs, most notably in New York (Mike Mussina, Jason Giambi, CC Sabathia, etc.) but also in Atlanta (Greg Maddux) and St. Louis (Jim Edmonds, Matt Holliday).
At the other end of the spectrum are the efficiency-minded A's. They have consistently had low payrolls but succeeded thanks to homegrown players (Miguel Tejada and the "Big Three" of Tim Hudson, Mark Mulder and Barry Zito), using the departures of those players to accumulate more young players via trade and draft pick compensation and a bargain-basement approach when searching for free agent value.
A similar ranking focusing on just the past decade (2004-onward) yields a high concentration of big payroll teams near the top. More interesting is a look at the range of average rankings among teams making the playoffs with some degree of frequency. Here are those with three or more appearances in the past decade:
Team | Playoffs | Avg Rk |
|---|---|---|
Rays | 4 | 26.3 |
Athletics | 3 | 25.7 |
Twins | 4 | 18.0 |
Reds | 3 | 16.7 |
Rangers | 3 | 15.3 |
Braves | 5 | 13.0 |
Cardinals | 7 | 10.6 |
Tigers | 4 | 8.5 |
5 | 7.6 | |
Dodgers | 5 | 6.0 |
Angels | 5 | 4.6 |
Red Sox | 6 | 3.0 |
Yankees | 8 | 1.0 |
On the stat-minded side, the Rays join the A's as efficiency's darlings, but one can't ignore the impact of successful scouting that has produced crops of inexpensive young talent via the draft and international amateur signings. The Twins, at their nadir the past few years but tied with four other teams with six wild-card era playoff appearances that yielded an average ranking of 19.5, show up here thanks in large part to the success they had at developing their own (Joe Mauer, Justin Morneau, Torii Hunter, Michael Cuddyer, Brad Radke) and acquiring other low-cost talent (Johan Santana via the Rule 5 Draft, Joe Nathan and Francisco Liriano via the trade of A.J. Pierzynski). The Reds are here largely for developing Joey Votto, Jay Bruce, Johnny Cueto, Homer Bailey and more. The Rangers' recent crop of homegrown players has only started to bear fruit (think Jurickson Profar and Martin Perez); they've been fueled by the fruits of the 2007 Mark Teixeira trade that netted Elvis Andrus, Matt Harrison and Neftali Feliz from the Braves, not to mention the Edinson Volquez/Josh Hamilton swap with Cincinnati.
Right in the middle of that pack but not to be overlooked in terms of the homegrown aspect are the Braves and Cardinals. Atlanta's past three playoff appearances have all come with the team ranked either 15th or 16th in payroll, and of its five postseason appearances in the past decade, only once did it rank higher than 10th (2004, eighth). In the post Maddux/Smoltz/Glavine era, talents like Brian McCann, Jason Heyward and the since-departed Martin Prado have fueled multiple playoff appearances and a new wave including Freddie Freeman, Craig Kimbrel, Kris Medlen, Mike Minor and Julio Teheran is poised to carry that run further even if the payroll includes expensive mistakes like Dan Uggla and B.J. Upton.
Likewise, the Cardinals have ranked higher than ninth in payroll only once among the seven times they've made the playoffs in the past decade, and that was back in 2005, when they were sixth. St. Louis has set itself up well in the post-Pujols era by melding scouting and analytics to produced a bumper crop of inexpensive talent that could continue to flourish; think Matt Adams, Matt Carpenter, Allen Craig, David Freese, Jon Jay, Lance Lynn, Shelby Miller and Trevor Rosenthal joining Yadier Molina, with the likes of Oscar Taveras and Kolten Wong waiting in the wings.
Jay Jaffe is a contributing baseball writer for SI.com and the author of the upcoming book The Cooperstown Casebook on the Baseball Hall of Fame.