Yankees, Dodgers Prove Playoffs Are Being Dominated by Bullpens and Strikeouts

Between the two Wild Card games and the three Division Series that didn’t end in sweeps, the 2017 postseason has already produced a whole lot of thrills and some surprising spills. Though we’re just nine days deep into the October tourney with one Division Series game to play, some trends have already become apparent, even within the small statistical samples produced. To these eyes, here are five things that stand out in particular.
1. Short, but not so sweet
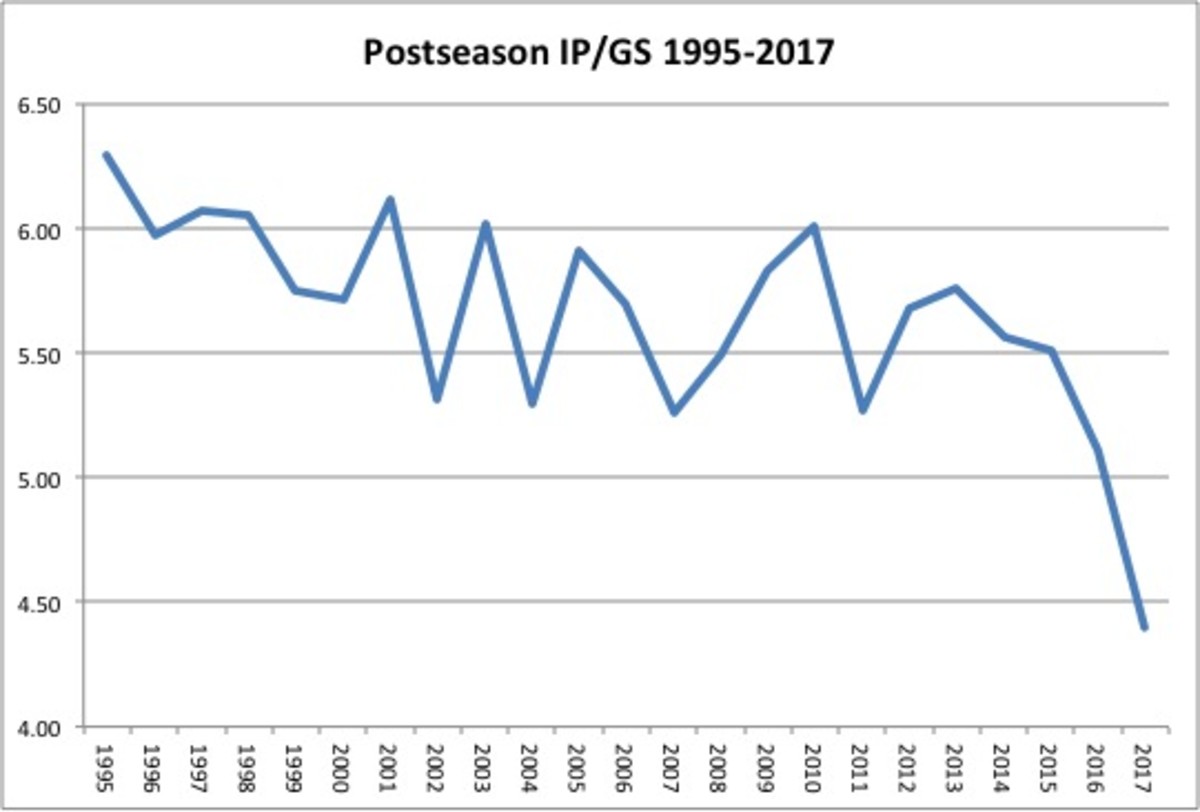
Through the first five days of the postseason, starting pitcher served primarily as whipping boys, with even the aces and frontliners routinely getting lashed. Prior to Sunday's pitchers' duel between the Yankees' Masahiro Tanaka and the Indians' Carlos Carrasco, postseason starters had been lit for a 6.50 ERA while averaging just 4.2 innings per turn. Some nifty work by that pair plus the likes of Yu Darvish, Max Scherzer, Stephen Strasburg and others has helped level things off, but through Wednesday night, the numbers are still rather ugly: 4.60 ERA and just 4.4 innings per start. By comparison, in the regular season, starters combined for a 4.49 and 5.5 innings per turn, respectively.
If this trend continues, the starters’ swollen ERA would be the highest in a single postseason since 2011 (4.87), the year that Tony La Russa steered a wobbly Cardinals rotation to a championship using a lot of quick hooks. Eight times in 18 games, the St. Louis starter failed to complete five innings, but the Cardinals won six of those games. For the championship run, Cardinals starters posted a 4.60 ERA and averaged just 5.1 innings per start.
The Yankees Stunned the Snakebitten Indians With Their Power and Bullpen to Win the ALDS
In that sense, the 2011 season looks more like the turning point than last year's Terry Francona experimenting, which set the template for what we've seen in this year’s playoffs. Instead of letting a starter go deep into a game, teams are weaponizing their bullpens. Much like the 2014-15 Royals and last year's Indians, this year's Yankees are the latest team to stack their relief corps. While managers have been going shorter with their starters in recent years, the plunge from last year to this year (so far) is quite dramatic:

As it stands right now, relievers have actually pitched more innings than starters (160 ⅔ versus 158 ⅓), which would be a first if it holds up. Even in the Wild Card era, the average postseason start had never dipped below five innings until this year, and it appears unlikely to climb back above that this fall. It would take teams averaging an even 6.0 innings per start for the final NL Division Series game, a pair of seven-game LCS and a seven-game World Series just to get the overall average back to 5.0.
Perhaps because they know they’re not being counted on to pitch deep into games (and can expend more energy earlier), postseason starters are still striking out a record level of batters; 10.2 per nine; last year’s 8.656 per nine was .008 below 2013’s mark for the previous high. The spike isn’t as impressive on a per-batter basis, because of the extra hits and homers they’ve allowed, but this year’s 26.1% rate is still sharply ahead of last year’s record 23.3% rate. It’s also ahead of the relievers’ 25.3% rate (which is short of the record 26.2% from 2015). Which brings us to…
2. Strikeouts everywhere
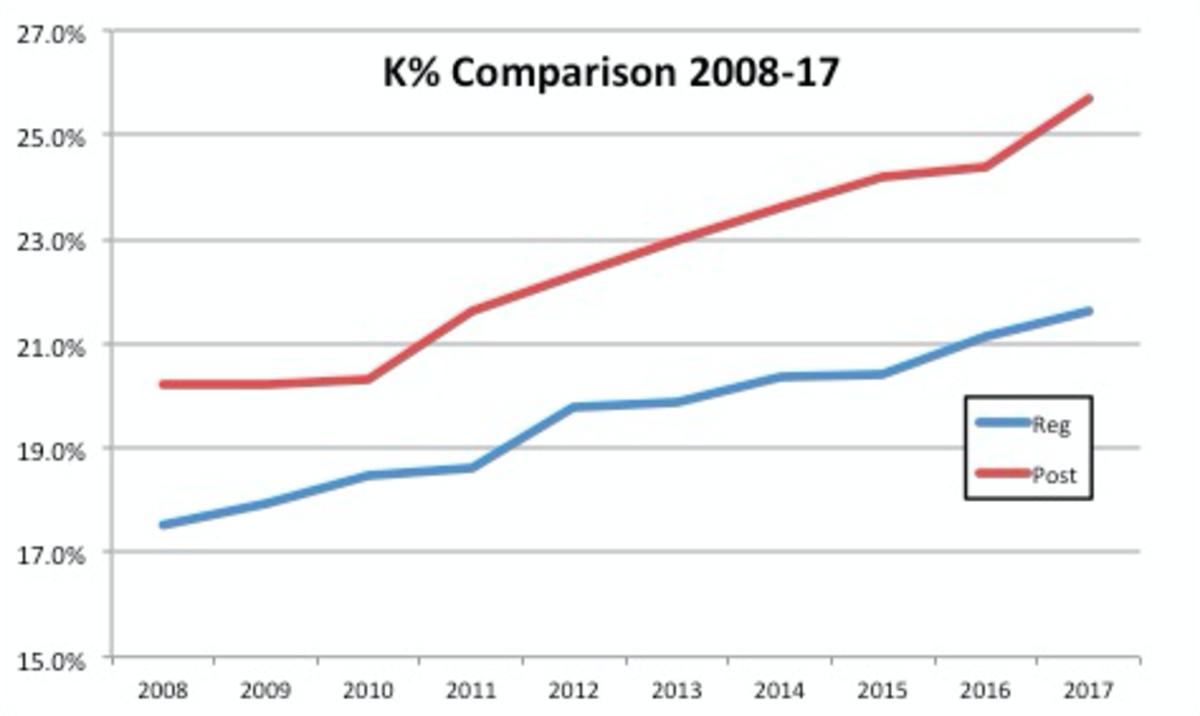
After a record year for strikeouts (40,104 total), it’s not surprising that we’re seeing higher strikeout rates in the postseason, but this year’s overall rate (25.7%) is still far above the regular season rate (21.6%). Over the past decade of ever-increasing strikeout rates, the gap between regular- and postseason rates is widening:

Wednesday night’s thrilling Game 5 between the Yankees and Indians featured 30 strikeouts, a postseason record for a nine-inning game. Yankees rightfielder Aaron Judge set an individual record for a postseason series, with 16 strikeouts in the five games. In addition to leading the majors in homers (52) and walks (127), Judge led the majors with 208 K’s, but his postseason K rate (55.2%) is nearly double his regular season rate (30.7%). Of the other postseason participants, only three have at least nine strikeouts so far: teammates Gary Sanchez (10) and Greg Bird (nine) and the Cubs’ Kris Bryant (nine).
3, Mighty ‘Pens
With so much riding on bullpens, it rates as a mild shock that the Indians are done, as theirs has produced the lowest ERA (1.69), rate of inherited runners scored (5.9%) and second-highest strikeout rate (33.0%) thus far. That ERA is somewhat deceiving, though, as it conceals the three crucial unearned runs that they allowed. Two came in the second inning of Game 4 following third baseman Giovanny Urshela’s two errors, and the third came on Wednesday night when Jay Bruce’s bad throw in the ninth inning allowed Todd Frazier to score from first on Brett Gardner’s ninth-inning single. Still, the Indians’ series loss had more to do with the short starts that preceded them, by Trevor Bauer and Corey Kluber, respectively.

Among the other bullpens, the Nationals (1.86 ERA, 21.1% strikeout rate, 33.3% inherited runner scoring rate) Yankees (2.20 ERA, 37.5 K%, 18.8 IRS%) and Dodgers (2.31 ERA, 23.8 K%, 40.0 IRS%) have risen to the occasion, while those of the Astros (5.51 ERA, 19.1 K%, 66.7 IRS%) and Cubs (6.57 ERA, 19.6 K%, 55.6 IRS%) have been lousy. Houston is through to the ALCS nonetheless, but the Cubs are in danger of being eliminated by the Nationals due in no small part to the late-inning gopher balls served up by Carl Edwards and Mike Montgomery in Game 2 (three-run shots by Bryce Harper and Ryan Zimmerman, respectively) and by Wade Davis in Game 4 (Michael A. Taylor’s grand slam).
4. The Guillen Number
This year didn't just just produce a record number of home runs—6,105, 1.26 per team per game. As I noted last month, it also produced a record percentage of runs scored via homers, 42.2%, breaking last year's record (40.2%), which in turn broke that of the year before (37.3%). Baseball Prospectus tracks this stat. It was BP alum and SI contributor Joe Sheehan who introduced it several years ago, calling it the Guillen Number after noticing that the successful White Sox teams managed by Ozzie Guillen were actually much more reliant upon homers than the small-ball tactics that drew so much attention.
The 10 teams in this year's postseason run the gamut from the Yankees, who ranked sixth in the majors in percentage of runs via homers (46.7%) to the Red Sox, who ranked 29th (33.8%). In all, those 10 teams averaged 41.3%, slightly less than the MLB average, but the lowest ones besides the Sox, namely the Indians (20th, 40.6%), Twins (24th, 39.6%) and Rockies (26th at 37.6%), have fallen by the wayside. Of the other remaining teams, the Dodgers were 10th (44.7%), Cubs 14th (42.9%), the Nationals 15th (42.6%) and the Astros 16th (41.9%).
Nationals' Stephen Strasburg Quieted All Critics With His Brilliant Silencing of the Cubs
As that range of the participants suggests, the Guillen number itself is descriptive, not prescriptive. This year, the correlation between it and winning percentage is just .08, ever so slightly positive but essentially random. That said, research by Ben Lindbergh (then at Grantland, now at The Ringer) has shown that teams more reliant upon home runs during the regular season tend to suffer smaller offensive fall-offs in the postseason than teams that are less home run reliant. Since good teams tend to have good pitching and good defenses, it's harder for opposing lineups to string together the multiple results on balls in play needed to score. Short-sequence offenses work best because all you need is one mistake and a very hard-hit ball.
With an even greater rate of home runs in the postseason (1.38 per team per game thus far), it’s no surprise they’ve come to account for an ever-increasing percentage of runs in the postseason:
Year | RHR | Rank |
|---|---|---|
2013 | 35.3% | 31.9% |
2014 | 33.4% | 33.35 |
2015 | 37.3% | 41.7% |
2016 | 40.2% | 43.1% |
2017 | 42.6% | 52.1% |
With one more game remaining in the first round, more than half of the runs scored so far (including in the Wild Card games) have come via homers. It seems unlikely that the trend will continue to be this extreme through the next two rounds, but it bears watching.
5. Kershaw’s rest
The Dodgers have won five straight NL West titles and are back in the National League Championship Series for the second year in a row (and the third time in that five-year span), but they still haven’t reached the World Series since 1988. One reason why things might be different this year is that their Division Series sweep of the Diamondbacks allowed them to avoid using Clayton Kershaw on three days' rest for Game 4. Mind you, Kershaw has actually pitched pretty well under such circumstances, allowing nine earned runs in 25 2/3 innings (3.16 ERA) with a 34/6 strikeout-to-walk ratio and just two homers allowed; five of those earned runs came in last year's 6 2/3-inning start against the Nationals, but they won anyway. In fact, the Dodgers have gone 3–1 in those games, losing only in 2014 to the Cardinals.
Heroics From Didi Gregorius, Brett Gardner and Aroldis Chapman Have Yankees in ALCS
Since the Dodgers were eliminated by the Mets in Game 5 of the 2015 Division Series, Kershaw has only made two starts after the short rest ones, and he's acquitted himself well, allowing one run (unearned) in six innings in Game 2 of the 2013 NLCS against St. Louis and, after his two-thirds of an inning save against Washington in Game 5 last year, seven shutout innings against the Cubs in Game 2 of the NLCS. Both of those were 1–0 games, and the Dodgers split those, losing to the Cardinals in the first of them and beating the Cubs in the second.
Despite his managers keeping him on short pitch counts there (72 against St. Louis, 84 against Chicago), where Kershaw has faltered is in his next start after that, which is to say his fourth start of the postseason: seven runs in four innings in Game 6 of the 2013 NLCS, and five runs (four earned) in five innings in Game 6 of the 2016 NLCS; both outings spelled the end for the Dodgers. He's also struggled in his Division Series openers, allowing a combined 19 earned runs in 31 2/3 innings, with just two quality starts out of 5.
Throwing that into a table, along with average pitch counts:
Start | Average IP | ERA | Average Pitch Count |
|---|---|---|---|
1 | 6.3 | 5.40 | 110 |
2 | 6.4 | 3.16 | 99 |
3 | 6.5 | 0.00 | 78 |
4 | 4.5 | 11.00 | 96 |
Obviously, we’re squinting at small sample sizes, but that's a strange pattern, isn't it? What it suggests is a pitcher running out of gas the deeper he pitches into the postseason, even when kept on a shorter leash. Of course, we know about the split that TBS cited during his Game 1 start, regarding his collapses after six innings, a pattern that held true in this year's Game 1 start. For the years 2013–17, here's the breakdown:
Innings | IP | H | BB | SO | ERA |
|---|---|---|---|---|---|
1–6 | 74 | 52 | 15 | 94 | 2.80 |
7+ | 6 | 14 | 6 | 8 | 24.00 |
Holy cow! Those six innings are spread over nine appearances, and they include the impact of subsequent relievers allowing inherited baserunners to score. There's no getting around that ugliness except to suggest that manager Dave Roberts would be better off pulling him too soon rather than too late. But maybe, with some extra rest—he'll have seven full days when the Dodgers square off in the NLCS opener on Saturday—the outcome will be different this time, and the game’s resident ace will help the Dodgers win their first NLCS in 29 years.
