Why Bryce Harper Could Experience a Career Resurgence if He Signs With the Phillies

When the Philadelphia Phillies met with Bryce Harper last Saturday, their best sales pitch should have been this: You have the opportunity to play the prime of your career in a great hitters’ ballpark.
To sign Harper might require the Phillies to spend a record amount of money: either an average annual value of more than $34.4 million (breaking the record of Zack Greinke) or at least $326 million (breaking the record of Giancarlo Stanton). But the terms follow a sales pitch that the Phillies can present better than any other club. The Yankees, despite all their money and righthanded hitting, appear to have never had much interest in a 26-year-old lefthanded slugger on a Hall of Fame track with the biggest profile in baseball.
The intersection of Harper’s prime years and Citizens Bank Ballpark should be an irresistible temptation for the Phillies. Harper has played his career in a home ballpark, Nationals Park, that is at best neutral for hitters.
Take a look at this: where Citizens Bank Park and Nationals Park rank among all major league parks in Home Run Park Factor since Harper reached the big leagues. The higher the rank, the friendlier the park is to home runs.
Home Run Park Factor Ranks
Year | Citizens Bank Park | Nationals Park |
|---|---|---|
2018 | 4 | 5 |
2017 | 1 | 13 |
2016 | 7 | 15 |
2015 | 6 | 14 |
2014 | 6 | 29 |
2013 | 1 | 26 |
2012 | 11 | 13 |
Park factors generally work best when you look at multi-year samples, so over the course of Harper’s career, it’s not even close. Harper will hit more home runs if he signs with Philadelphia than if he stays in Washington. How many? Here’s one snapshot.
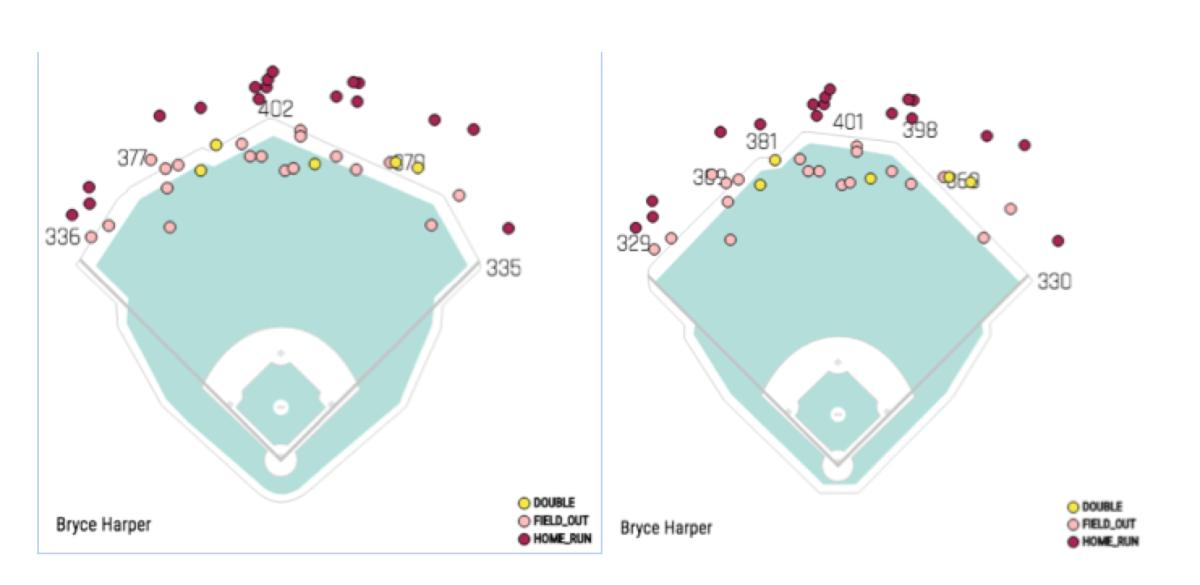
Take a look on the left at all fly balls and line drives Harper hit at home last year that carried at least 329 feet (the shortest distance at Citizens Bank Park). Now take those same batted balls and pretend he hit them in Philadelphia instead of Washington (the diagram on the right). Judging by these numbers and video, Harper would have hit four more home runs—to rightfield and the leftfield power alley.

Running the same exercise in 2015, when Harper won his MVP, gives you five more home runs in Philadelphia.
The park effect for Harper might be even greater because he is entering his power prime. His overall home run numbers, no matter where he plays, figure to go up. How much?
Try this exercise. Through age 25, the home run hitters Harper most resembles are Ken Griffey Jr., Hank Aaron and Andruw Jones, both in terms of volume and rate of home runs.
Through Age 25
Player | AB | HR | AB/HR |
|---|---|---|---|
Bryce Harper | 3306 | 184 | 18.0 |
Ken Griffey Jr. | 3440 | 189 | 18.2 |
Hank Aaron | 3524 | 179 | 19.7 |
Andruw Jones | 3520 | 185 | 19.0 |
Ages 26-30
Player | AB | HR | AB/HR | All-Star Games | Seasons w/ MVP Votes |
|---|---|---|---|---|---|
Ken Griffey Jr. | 2912 | 249 | 11.7 | 5 | 3 |
Hank Aaron | 2986 | 187 | 16.0 | 5 | 5 |
Andruw Jones | 2888 | 183 | 15.8 | 3 | 3 |
The home run rates of Griffey, Aaron and Jones all went up—and by a cumulative 25%. They combined for 13 out of 15 possible All-Star selections and gained MVP support in 11 of those 15 years.
So let’s say that Harper’s home run rate rises 25%. And let’s say we give him four extra homers a year by virtue of playing his home games in Philadelphia. If we give him 2,928 at-bats over the next five years (the average of Griffey, Jones and Aaron), Harper would hit an average of 47 homers a year as a Phillie for the next five years in a best-case scenario. Conservatively (say his home run rate matches Jones’ rate), he totals 39 dingers a year without the Philly ballpark bonus.
Time to acknowledge the skeptics. Harper has hit 35 home runs only once, and never more than 42. He batted .249 last year, including a disaster of a first half in which he hit .214 and scared some scouts into thinking this is what happens when his violent, unorthodox swing gets out of whack. There is a fear that he is injury prone, so what good are projections if he can’t stay on the field?
Remember that two of Harper’s past three seasons were compromised by injury. In 2016 he wrecked his right shoulder diving back into a base in Milwaukee, and played the rest of the season with a shoulder so weak he could not lift weights and could hardly throw. In 2017 he was on his way to winning a second MVP by age 24 when he slipped on a wet base and hyperextended his knee*.
*I’ve been saying it for years: how many players have to break their thumbs on bases and slip on wet bases before baseball wakes up and realizes it needs bases made of a safer material? How many stars do we have to lose to avoidable non-contact injuries? How the players association does not see this as a hazardous workplace environment issue is beyond me.
Even with those injuries, and the atrocious start to last season, take a look at where Harper ranks among major league leaders over the past four seasons:
MLB Leaders, 2015–18 (Min. 500 G)
On-Base Percentage
1. Joey Votto | .442 |
|---|---|
2. Mike Trout | .435 |
3T. Bryce Harper | .410 |
3T. Paul Goldschmidt | .410 |
5. Freddie Freeman | .391 |
OPS
1. Mike Trout | 1.031 |
|---|---|
2T. J.D. Martinez | .967 |
2T. Joey Votto | .967 |
4. Bryce Harper | .952 |
5. Paul Goldschmidt | .948 |
OPS+
1. Mike Trout | 183 |
|---|---|
2. Joey Votto | 158 |
3. J.D. Martinez | 155 |
4. Bryce Harper | 150 |
5T. Nelson Cruz | 147 |
5T. Freddie Freeman | 147 |
So despite two injuries and a terrible first half, Harper has been one of the four or five most productive hitters in baseball—and with what should be his best years ahead of him. In Harper you are buying proven abilities to get on base and hit home runs, which pretty much defines how offense is played these days.
“What happened to him in the first half of the season was the best thing to happen to him,” said Kevin Long, Nationals hitting coach. “It truly tested him. That’s when you find out about yourself as a hitter—when you struggle. He made adjustments and put up a big second half.”
Harper made two key adjustments: he stopped trying to hit over the increased number of defensive shifts he saw, and with two strikes he spread his stance farther and eliminated his big leg kick.
“A lot of our guys started doing it because of Juan Soto, believe it or not,” Long said, referring to the Rookie of the Year runnerup. “Guys were spreading out, getting into their legs and choking up. They saw how well Soto did it, the quality of his at-bats, even with two strikes.”
Harper’s adjustments are easy to measure. He cut down on his launch angle, which also reduced his pop-ups and strikeouts:
Harper 2018 Splits
| Launch Angle | Pop-Ups | K% Rate |
|---|---|---|---|
First Half | 14.7 | 13 | 24.6% |
Second Half | 12.8 | 8 | 23.8% |
Long is right: that kind of adjustment is a good sign. Harper turned around what could have been an awful “platform” season and instead reached 100 runs batted in for the first time.
Ten-year contracts are risky. They tend to turn ugly on the back end, especially as baseball becomes a younger man’s game. As velocity and spin increase, youthfulness gains value while the importance of wisdom of experience diminishes.
Last year there were only 10 qualified hitters age 33 and up who posted an OPS+ of at least 100—half as many as two years earlier. In 2007 there were 29 such players.
But right now every team has the chance to buy the prime of Harper’s career, a rare kind of buy on the free agent market because of his age and resume. Those years look even better in Philadelphia.
