What Is Baseball in 2019? A Troubling Number of Record-Setting Trends

This story appears in the May 20, 2019, issue of Sports Illustrated. For more great storytelling and in-depth analysis, subscribe to the magazine—and get up to 94% off the cover price. Click here for more.
Baseball likes to cling to the notion that the game is timeless, that a time-traveling fan would instantly recognize the game of any era as familiar. The modern game is blowing up that quaint belief. Baseball today hardly resembles what it did even five years ago.
As baseball enters its quarter pole to the season, several deepening trends show the sport continues to evolve into more of a boom-or-bust game, with great yawning gaps of inaction punctuated by the quick dopamine hit of the home run.
The subtleties, strategies and nuances of the sport are being sandblasted away. Chess becomes checkers; poker becomes blackjack–only with every hand beginning with 16.
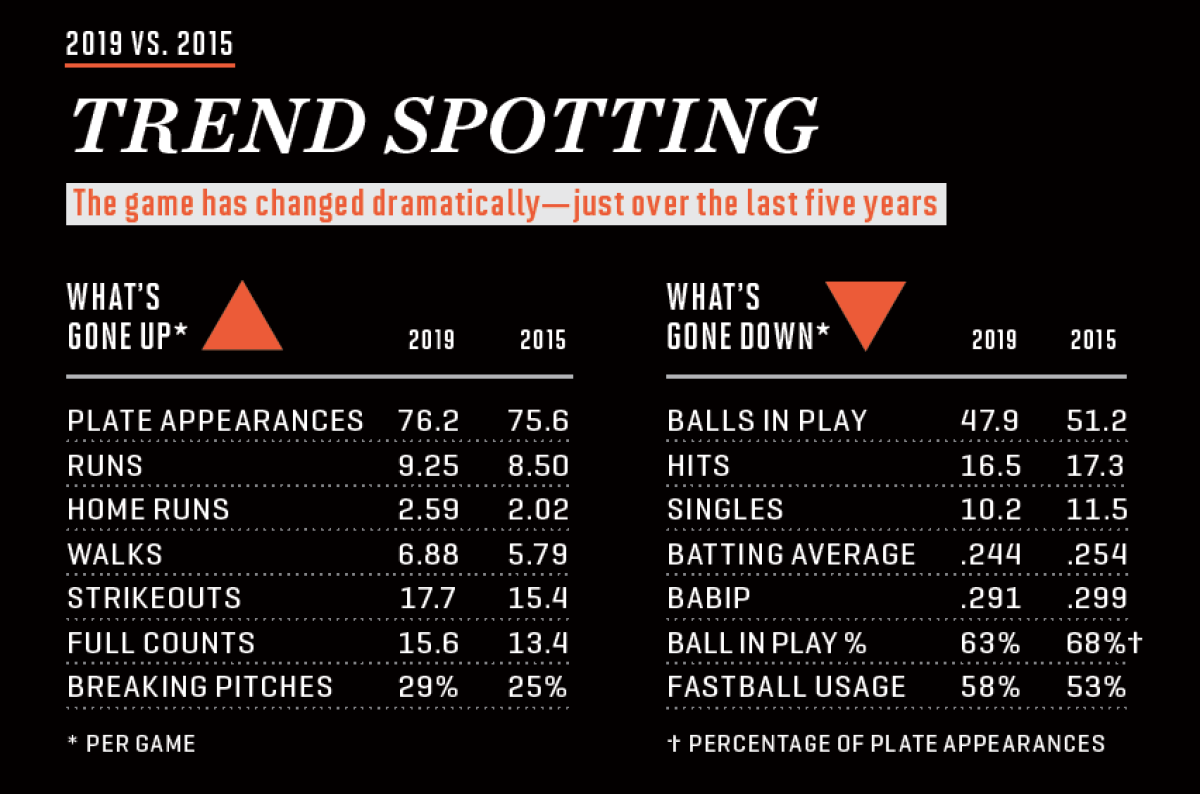
Here is what the first quarter of 2019 tells us about where baseball is and where it is going:
• Strikeouts, up for a 14th consecutive season, are at another all-time high.
• Walks have reached their highest rate in 19 seasons.
• Home runs are at a record level (2.6 per game). Four of the five seasons with the greatest rate of home runs have occurred in the past four years.
• Those so-called Three True Outcomes (strikeouts, walks and homers) account for 36 percent of all plate appearances, up from 31 percent in 2015.
• The rate at which hitters swing and miss is up for a seventh straight year, each year a record high.

• Pitching is so good that the average game has more foul balls than balls actually put in play.
• Balls in play are down for a sixth straight year.
• The average game includes 252 pitches when the ball is not put in play, up from 238 in 2015 and 211 in 1989.
• When hitters do put the ball in play, their chance of getting a hit is the worst in 27 years. Batting average on balls in play had been rock steady (.295-.300 for the previous 11 years) even with the rise in defensive shifts. But it is down sharply this year to .292.
• Pitches per plate appearance are up for a fourth straight season to 3.93. All four years are the highest since pitch recording began in 1988.
• Full counts are up for a fourth straight year.
• Singles are down for a fifth straight year. They are more rare than any time in baseball history.
The most contested piece of real estate in a baseball game always has been the 60 feet, six inches between the pitching rubber and home plate. The confrontation between pitcher and batter is the ignition switch to the action. But increasingly in today’s game, it is the entirety of the action.
Teams use a bucket brigade of pitchers not just to get hitters out but also to keep the ball out of play, or at the very least, in the ballpark. Hitters, knowing that multiple-hit rallies are scarce against such a phalanx, hunt for one mistake they might be able to hit over the fence. This dance of passive-aggression leads to longer and longer at-bats, more and more of which end without the ball in play–without players in motion.
The Los Angeles Dodgers, Milwaukee Brewers, Minnesota Twins and Tampa Bay Rays play the modern boom-or-bust game as well as any team. The Dodgers ran out to the best record in the National League with the second-most home runs while letting their starting pitchers throw an average of just 85 pitches; only the Braves' and Padres' rotations had shorter leashes. The Brewers hit even more homers (68) and averaged the fewest innings per start in the league (4.8).
The Twins live so heavily off the home run (third in baseball) that they had the best record in baseball with the fewest singles in the league. Rays pitchers are masters at avoiding home runs (35, fewest in the AL).

It’s easy to see where this style of play began. In the past decade owners turned over control of how their teams played baseball from the manager, who relied on experience and observational skills, to the chief baseball executive, who relied on analytics.
Simultaneously, boom-or-bust baseball happened only because of a huge growth in the inventory of quality pitchers. The flood of information and skill-specific training heavily favor the side that initiates the action (the pitcher), not the one that reacts to it (the hitter).
The pipeline of arms gushes. In April 2015, for instance, 82 pitchers threw at least one pitch 97 mph. This April, 114 pitchers threw that hard.
Less certain is what baseball does about how this game is being played. It is clear that the narrowing of baseball to a protracted two-man battle of inertia has been a five-year slog, not a small sample trend. MLB this year is using the independent Atlantic League as a test lab, trying such remedies as a ban against defensive shifts and, eventually, pushing the pitching rubber back two feet in hopes of getting more balls in play.
In the meantime, enjoy the push-pull between strikeouts and home runs. The season is just getting warm.
Who can blame a hitter for trying to lift the ball in the air? Pitchers are throwing more breaking balls, managers are making more pitching changes, defenses are shifting more and it’s never been harder to get a single. With so much conspiring against the hitter, he can try to leverage the one change in his favor: the baseball is flying farther.
Baseballs started flying farther in the second half of the 2015 season, which led to a record home run year in 2017, which led to an investigation into the baseball’s properties by a panel of scientists commissioned by Major League Baseball. The report, released in May of 2018, confirmed that the baseball was livelier–it produced less drag as it cut through the air–but could not firmly establish a root cause. The report hinted the more aerodynamic baseball could be due to a change in the surface texture of the ball or the center of the ball’s gravity.

One year later, the baseballs are even livelier. Home runs are flying out of parks at a record pace–and home runs typically pick up as the weather warms.
Here is a look at how more flyballs and line drives are turning into home runs than they did in the record year of 2017. Moreover, the jump compared to April 2015–before the start of the more aerodynamic baseball–is staggering.
April Home Runs
| Home Runs | Fly Balls + Line Drives | Percentage |
|---|---|---|---|
2015 | 592 | 8,096 | 7.3% |
2016 | 740 | 8,689 | 8.5% |
2017 | 863 | 9,075 | 9.5% |
2018 | 912 | 10,316 | 8.8% |
2019 | 1,144* | 10,781 | 10.6% |
*All-time record
If the baseball carried the same way this April as it did in April 2015, we would expect to see 787 homers. Instead, we saw a record 1,144 dingers–a 45 percent increase with the livelier ball.
Another way to confirm the baseball is flying farther is to examine what happens when you don’t make optimum contact. The average exit velocity of a flyball home run is 103.9 MPH. What happens if you hit a fly ball just below that average? It’s 22 percent more likely to be a home run this year than it was last year and 41 percent more likely to be a homer than it was in 2015.
