The Year of Bad Bullpens: MLB's Pitching Model Is Broken

Relief pitching has reached a tipping point.
For half a century, ever since the mound was lowered in 1969, relief pitchers posted a lower ERA than starting pitchers. That no longer is true.
As managers go to bullpens earlier and earlier, and as the use of openers grows, workload is catching up to bullpens.
Relievers have a higher ERA (4.50) than starters (4.44) for the first time since 1969. Only three years ago, relievers’ ERA was almost half a run better than that of starters (3.93 to 4.34).
Bullpen ERA this year is the second worst in the past 69 years (only 2000 was worse) and the eighth worst of all time. And it’s getting worse as the workload piles up. Monthly bullpen ERA this year: 4.37 in April, 4.45 in May and 4.72 in June, making this the worst June for relievers since 1950.
How managers run a modern game is based on the premise that a phalanx of power-armed relievers is a better option than a starter facing a lineup for a third time. And so every year since 2016 managers have heaped more and more work on bullpens, hitting another record this year at an average of 3.62 innings each game. Starters are pulled after an average of just 88 pitches, down from 97 in just nine years.
Now managers (honestly, most teams’ analytics department tells a manager how to deploy his pitchers) better re-think that premise.
“Look at it this way,” said Braves first baseman Freddie Freeman. “If you bring four or five relievers into a game every night, what are the chances that one of them is going to have a bad night? Pretty good, right? And if you do use four or five relievers every night, there’s going to be an attrition factor. As hitters, we’ve gone back to the idea of ‘Let’s get into their bullpen.’”
Last week, in a 2-2 game, Atlanta manager Brian Snitker let Max Fried pitch through the sixth inning, even though he gave up three singles that inning and finished with 101 pitches.
“Even if he walked [his last batter] he was staying in,” Snitker said. “You need to learn how to pitch through trouble. We need our starting pitchers to pitch the bulk of our innings. If they do, we’re doing okay.
“I think what you’re seeing now around baseball is that a lot of elite relief arms are wearing out.”
Over the past two winters, teams spent at least $8.5 million each on 26 veteran free agent relievers. At least 19 of them can be classified as poor investments or outright busts, including David Robertson, Andrew Miller, Jeurys Familia, Joe Kelly, Cody Allen, Brandon Morrow, Tommy Hunter, Jake McGee, Wade Davis, Bryan Shaw and Luke Gregerson. Throwing power sliders and max-effort high velocity fastballs 50 to 70 games a year–not to mention all the times relievers warm up in the bullpen–is bound to take a toll.
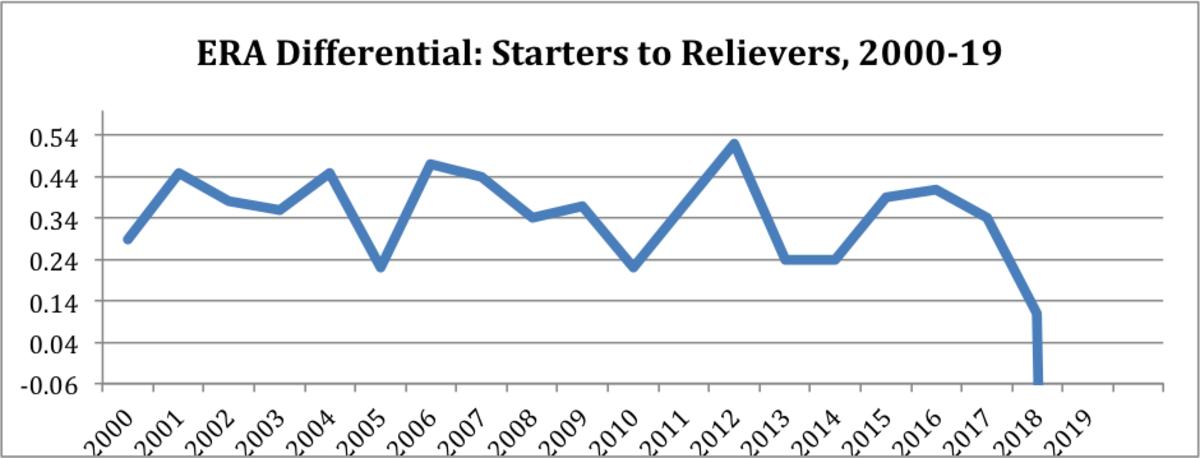
What you have to understand is just how unusual it is to see relief pitchers faring worse than starters–and how quickly we have arrived at this strange place. Here is the ERA differential between starters and relievers just in the past 19 seasons. As you can see, relief pitching has cratered suddenly, wiping out what traditionally has been a wide gap between starters and relievers.

Here are some of the factors involved in this bullpen collapse:
1. Acceptance of openers
The Rays’ quirky experiment is now thought to be a smart way to get through a game when you don’t have a starter you trust. Two years ago there were only 133 games in which the starter did not pitch more than two innings. This year baseball has doubled that rate. Teams are on track for 269 such abbreviated starts.
The opener concept works, but the more built-in abbreviated starts a team uses the more trouble you’re in when one of your traditional starters simply doesn’t have it and that game also becomes a bullpen game. There is a compounding effect with too many short starts.
2. More pitching changes
Games last season in which a manager used at least five relievers spiked 28 percent from the previous season. That rate is down slightly this year, but already there have been more such games this year than every season from 1996-2000, smack in the Steroid Era.
3. More home runs
The rate of home runs this year is the root cause of most every trend in baseball these days. Relief pitchers are not giving up many more hits. Batting average against bullpens is .247, barely up from the past four years (when it was either .245 or .246). But bullpens are getting bulldozed with extra base hits. Check this out:
Highest Slugging Percentage Allowed by Relievers
Year | Slugging Percentage |
|---|---|
1930 | .426 |
2019 | .421 |
2000 | .418 |
1999 | .417 |
That’s amazing. The second-worst slugging allowed by relievers is happening right now–worse than even the Steroid Era. Relievers are on pace to give up more homers this month than any month in baseball history–breaking the record set in April of this season. And May will be the third most.
One twist to this bullpen attrition is that we are seeing more offense late in the games. ERA from innings seven through nine has jumped from 4.06 last year to 4.40 this year, the highest it has been in 19 years.
The Nationals this year have the worst eighth-inning ERA of all time (7.70). This year’s Tigers are fifth-worst (7.00).
The Orioles have the second-worst ninth-inning ERA of all time (7.71); the Rockies are sixth-worst in that inning (6.75).
This season may well be remembered as the Year of The Home Run. But this also is the Year of Bad Bullpens. The pitching model is broken. Will the game begin to adjust?
