MLB Changed More Than You Think in the 2010s

The winds of evolution always buffet baseball. Be it integration in the 1940s, franchise relocation in the 1950s, eight expansion teams and the rise of the players' association in the 1960s, Astroturf, free agency and the DH in the 1970s, and steroids, realignment and expanded playoffs in the 1990s, the game constantly is reshaped by its times as surely as a beachhead is by the tides.
Something very different happened to baseball in this last decade. It changed enormously, but almost entirely from within. There was no expansion (expanding only the record streak since the last one to 22 years), no relocation and no major structural change but for the second wild-card added in 2012. Only three ballparks opened–down from 12 in the construction boom of the previous decade.
Yet the game we watch today is vastly different from the one we watched in 2010. How baseball is played, managed and coached is strikingly different because of data and technology. Knowledge replaced wisdom, which is why key front office decision makers, managers and hitting and pitching coaches are getting younger.
Baseball today is amazingly more efficient than it was when the decade began. No player better defines the arc of the decade than J.D. Martinez. He reached the big leagues with the Astros in 2011, only to be released after three seasons with a .387 slugging percentage. By studying video, especially of Albert Pujols, and seeking private hitting coaches, Martinez realized, “Everything I was taught about hitting was wrong.”
Out went “Swing down on the ball. Be short to the ball. Make contact.”
In came “Swing up at the ball to match the plane of the pitch. Get the barrel in the zone early. Strikeouts are just another out.”
After changing his swing, Martinez has slugged .581–better than every other player except the incomparable Mike Trout–and signed contracts worth more than $130 million.
Efficiency has its cost. In using data to mine for every incremental edge, and tasking the players with processing more and more information, baseball in this decade became slower and less dynamic.

Baseball lost 4.5 million paid customers this decade, a 7% per-game decline. The 2010s joined the 1960s (down 13% as offense cratered) and the 1930s (down 11% as The Great Depression hit) as the only decades in which Major League Baseball attendance declined.
This is the decade in which baseball fostered a game antithetical to today’s fast-paced, crowded entertainment landscape: less action over a longer period of time. Time of game increased by 16 minutes in this decade, reaching a record 3 hours, 10 minutes in 2019.
That’s not even the most telling measurement. Worse than that has been the expanding gaps of dawdling and nothingness between pitches. In this decade players added 2.8 seconds between pitches, which by itself added 14 minutes of idle time to the average game. Somehow, these Dawdle Deniers still don’t see this as a major threat to the game’s popularity and future.
As players’ pace slowed, so did the frequency of balls put in play. The rise of technology and analytics mostly favors run prevention, and such has been the case with pitching. Instead of pounding fastballs the way past generations did, in this decade pitchers threw fewer fastballs, even as they threw harder. The rate of curveballs and sliders went up 25 percent this decade. Why? They are much harder to hit than fastballs, even elite ones. The average breaking ball is harder to hit (.220) than a fastball thrown 97 mph and faster (.238).
Knowledge over wisdom. Just follow the numbers. It works. Overall swings and misses went up 34%.
Baseball this decade became a boom or bust game. It pivots on home runs (because stringing hits together is too hard) and strikeouts. It is checkers more than chess. Rallies shrink. Strategy wanes. Maverick managers go extinct. And we as fans wait longer than ever to see a ball put in play. The past two seasons are the only ones in history with more strikeouts than hits.
In the average game from 2010 you would see a ball put in play once every 3 minutes 16 seconds. By the end of the decade it ballooned by more than a minute, to 4:17.
These are the three biggest increases in how baseball changed this decade:
1. Home runs went up 46% to an all-time record. That’s a bigger increase than through the steroid-addled 1990s (44%).
2. Swings and misses went up 34%. Pitching is crazy good. Baseball set aside oral history (“Throw down and away, son. Get on top of the ball. You can’t teach an arm like that.”) in favor of data-based, tech-savvy teaching. We now know we can increase velocity and shape the spin and look of pitches in pitching labs.
3. Time between balls in play went up 31%.
Only recently has technology begun to make significant inroads on the run production side. Most of it is dedicated not to maximizing contact but to maximizing damage. Hitters groove their “A” swing and chase exit velocity. It’s the equivalent of pulling out the driver on every hole, even the short par fours. Batting average, on-base percentage and singles all went down, but slugging went up. The next advances will come in developing multiple swings and approaches that fit the pitcher and count.
But hitters always will be behind. Their task is inherently tougher than those of pitchers. Pitchers initiate action and set the variables (speed, spin, release point, break, etc.). Hitters must react to those constantly changing set of variables.
Moreover, against more velocity and spin, a hitter’s job becomes even more difficult with every strike. Batters hit .154 against two-strike breaking balls last year, for instance. Strikeouts on breaking balls went up 28% this decade.
You might argue for hitters to concede and simply “put the ball in play” but hitters have done the math. They hit .236 when they hit a groundball with two strikes. Defense has improved, especially as data pinpoints the best place for fielders to take away hits from each batter. With two strikes, batters hit one home run for every two groundball singles. A similar risk-reward equation helps explain why three-point attempts in the NBA have gone up 87% this decade.
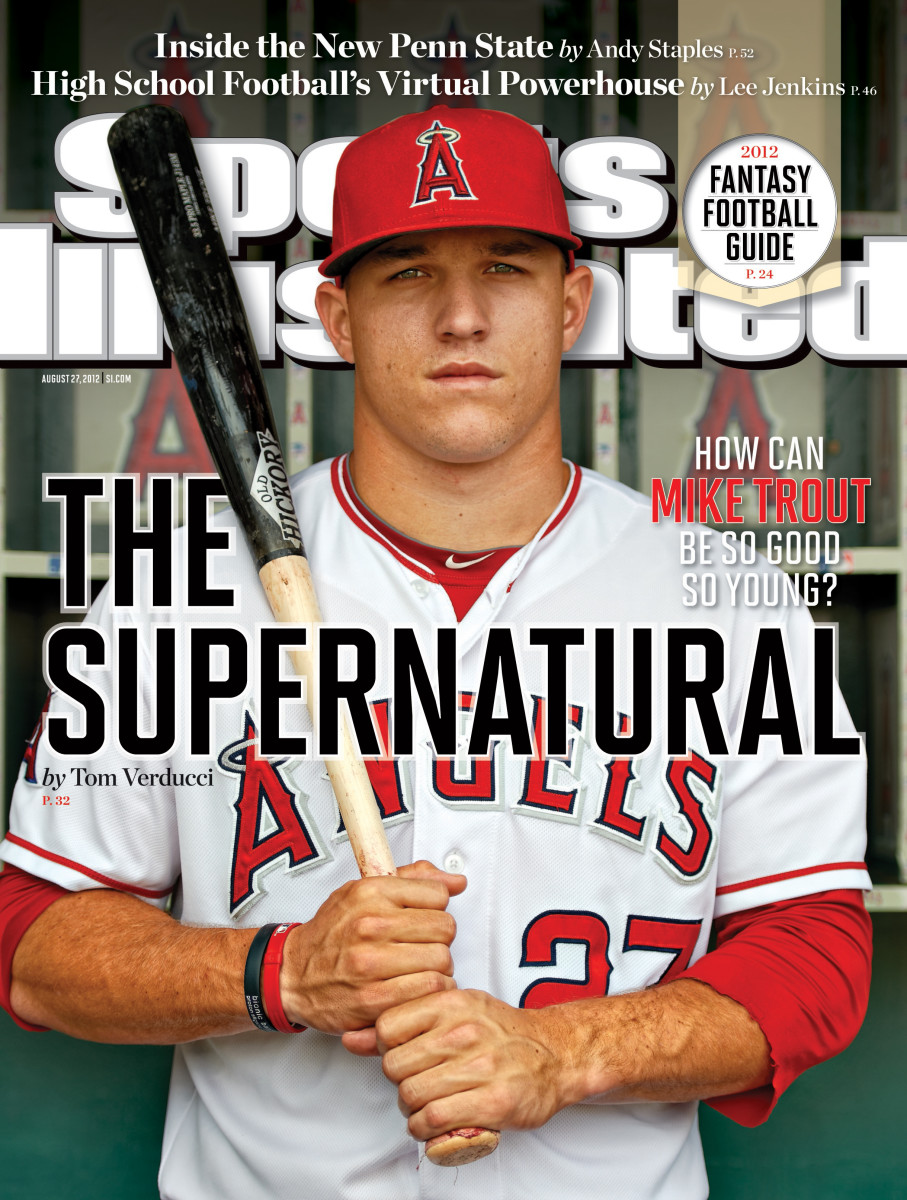
This was the decade of Trout, who spotted the field a year and still scored the most runs, slugged the highest and won three MVPs.

It was the decade in which a few old-school minded starting pitchers stood firm against the battalions of relievers who took over the game; Max Scherzer won the most games and struck out the most batters, Justin Verlander threw the most innings and Clayton Kershaw posted the lowest ERA.
Nelson Cruz hit the most home runs, Robinson Cano had the most hits and Pujols drove in the most runs–all of them born in the Dominican Republic, a country with fewer people than Pennsylvania.
The Yankees and Dodgers won the most games, but neither one of them won a World Series. Twenty-six teams reached the playoffs; four did not (Marlins, Padres, Mariners and White Sox). The Cubs finally won it all after waiting more than a century. No team successfully defended its World Series title, stretching the record streak to 19 teams that failed to repeat.
Yet what rises above the players and the teams in defining this decade is how data and technology changed how baseball is played. Midway through the decade Statcast debuted, in which every movement on the field, be it players or the baseball, is tracked by military-grade technology, providing a treasure trove of information.
As baseball better defined risk it became more risk averse. Stolen bases hit a 48-year low. Sacrifice hits fell to an all-time low. The hit-and-run play virtually died. The past decade also saw the implementation of the Utley Rule at second base, which banned aggressive slides, the Posey Rule at home plate, which banned most collisions, and expanded replay, which essentially eliminated all on-field arguments but for balls and strikes.
Technology not only helped Martinez (and many others) remake his swing. Verlander found another stage to his career with the help of super slo-motion cameras, Gerrit Cole became the most enriched pitcher in the game’s history because technology changed how and what he threw, and the data-heavy Dodgers shifted their defenders on 53% of all pitches last year, turning the traditional, century-old alignment of players into the exception, not the rule.
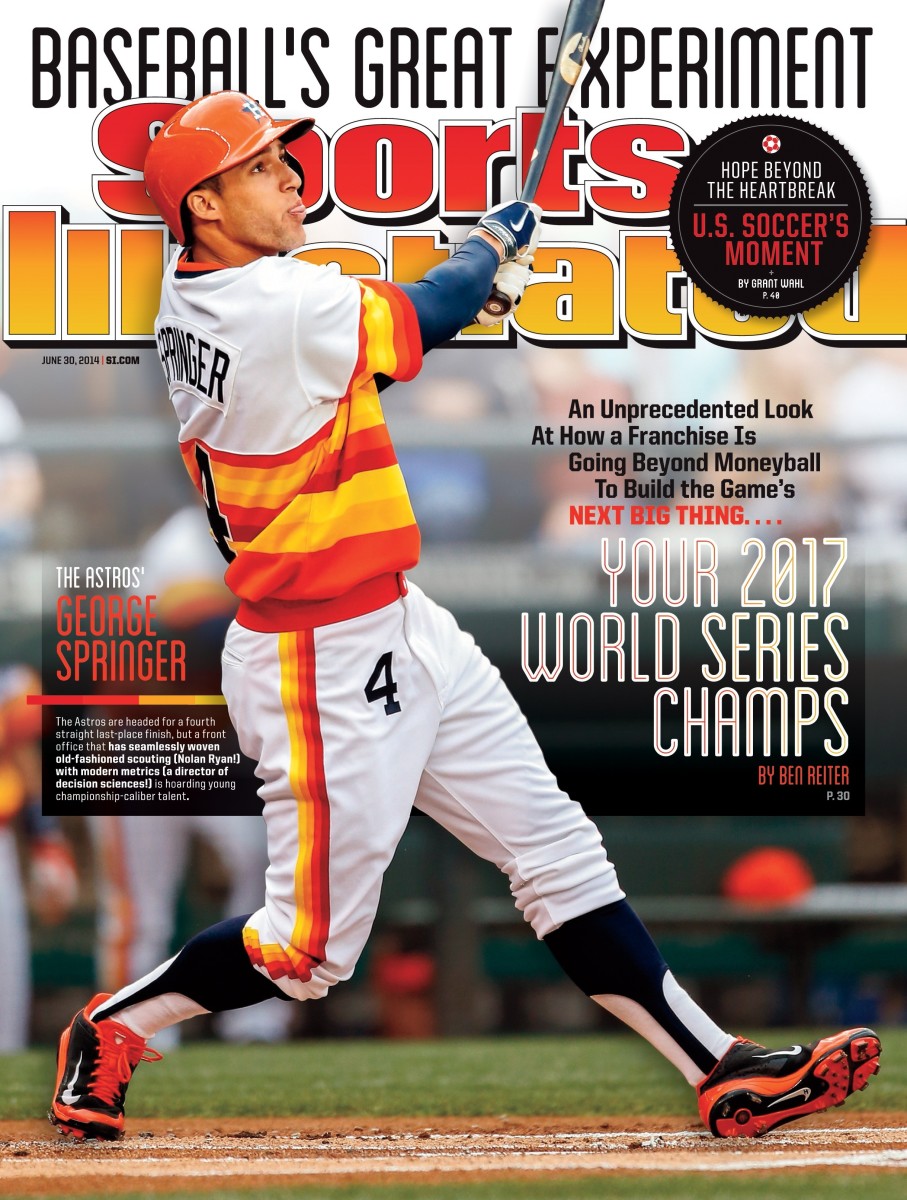
On the other hand, the Houston Astros proved what happens when you take technology too far–using it to surveil opposing dugouts and steal signs, willfully destroying the bedrock of competition and fair play.
The game has changed so much so fast that it is exciting to think what might come next. Is there a higher level of velocity for pitchers? Will the first generation of hitters who grew up with technology be better all-around hitters? Will pitchers and catchers exchange signs by headset or some other technology? Will baseball follow advances made in European soccer in training, nutrition and recovery to reduce injuries? Will technology be used to call balls and strikes?
In 2010 we could not imagine the game we have today and all the science in it, so we can only guess what baseball will look like in 2029. But this much we do know: the game cannot prosper with another decade in which the pace of action continues to slow as it did in this past one.
