%22%3E%0A%3Cpath%20d%3D%22M6.30776%200.541016H11.2571L17.553%2015.5899H12.1312L11.3398%2013.5818H6.10695L5.33915%2015.5899H0L6.29595%200.541016H6.30776ZM10.0995%2010.0381L8.72928%206.41172L7.35905%2010.0381H10.0877H10.0995Z%22%20fill%3D%22white%22%2F%3E%0A%3Cpath%20d%3D%22M18.1318%203.94302H22.9749V6.29366C23.6364%204.71082%2024.6995%203.69496%2026.6249%203.77765V8.91599H26.1169C24.0734%208.91599%2022.9749%2010.05%2022.9749%2012.625V15.5899H18.1318V3.9312V3.94302Z%22%20fill%3D%22white%22%2F%3E%0A%3Cpath%20d%3D%22M27.498%200.00952148H32.5183V3.10434H27.498V0.00952148ZM27.5807%203.94301H32.4238V15.6017H27.5807V3.94301Z%22%20fill%3D%22white%22%2F%3E%0A%3Cpath%20d%3D%22M33.6064%2012.5661L38.3432%207.74667H33.7954V3.94312H45.0407V6.97887L40.2804%2011.7983H45.0407V15.6018H33.6064V12.5661Z%22%20fill%3D%22white%22%2F%3E%0A%3Cpath%20d%3D%22M45.4298%209.81387V9.76662C45.4298%206.4828%2048.1584%203.65967%2051.9974%203.65967C55.8364%203.65967%2058.5296%206.43555%2058.5296%209.71937V9.76662C58.5296%2013.0504%2055.801%2015.8736%2051.9502%2015.8736C48.0994%2015.8736%2045.418%2013.0977%2045.418%209.81387H45.4298ZM53.8756%209.81387V9.76662C53.8756%208.60901%2053.0251%207.69947%2051.9502%207.69947C50.8752%207.69947%2050.072%208.62083%2050.072%209.73118V9.77843C50.072%2010.936%2050.9225%2011.8456%2051.9974%2011.8456C53.0723%2011.8456%2053.8756%2010.9242%2053.8756%209.81387Z%22%20fill%3D%22white%22%2F%3E%0A%3Cpath%20d%3D%22M59.7109%203.94316H64.554V5.56144C65.2981%204.60465%2066.4794%203.65967%2068.1213%203.65967C70.5782%203.65967%2072.1138%205.27795%2072.1138%207.91209V15.5901H67.2708V9.4595C67.2708%208.45546%2066.6684%207.87665%2065.9478%207.87665C65.2273%207.87665%2064.5658%208.45546%2064.5658%209.4595V15.5901H59.7228V3.93135L59.7109%203.94316Z%22%20fill%3D%22white%22%2F%3E%0A%3Cpath%20d%3D%22M73.1074%2012.2827V12.2355C73.1074%209.90844%2074.832%208.60909%2077.5488%208.60909C78.5293%208.60909%2079.7932%208.82171%2080.3011%209.03433V8.84534C80.3011%207.78223%2079.6396%207.15618%2078.1513%207.15618C76.9582%207.15618%2075.9542%207.41605%2074.9265%207.81767L74.076%204.59292C75.4226%204.08499%2076.9582%203.74243%2078.9899%203.74243C81.3642%203.74243%2082.8998%204.23855%2083.9157%205.2544C84.7898%206.12851%2085.1323%207.26249%2085.1323%208.95165V15.5901H80.2893V14.4207C79.4742%2015.2948%2078.3875%2015.8736%2076.9346%2015.8736C74.6903%2015.8736%2073.1192%2014.5979%2073.1192%2012.2827H73.1074ZM80.3483%2011.2787V10.7826C80.0649%2010.6762%2079.6396%2010.5936%2079.238%2010.5936C78.2812%2010.5936%2077.7496%2011.1724%2077.7496%2011.8929V11.9402C77.7496%2012.6253%2078.2458%2013.0741%2078.86%2013.0741C79.7105%2013.0741%2080.3483%2012.389%2080.3483%2011.2787Z%22%20fill%3D%22white%22%2F%3E%0A%3Cpath%20d%3D%22M0.0118058%2020.7717H5.72895C11.6587%2020.7717%2014.6236%2023.7012%2014.6236%2028.119V28.1662C14.6236%2032.584%2011.5878%2035.7261%205.55177%2035.7261H0V20.7835L0.0118058%2020.7717ZM4.99659%2025.1305V31.3673H5.82345C8.10322%2031.3673%209.57976%2030.4224%209.57976%2028.2725V28.2253C9.57976%2026.0754%208.10322%2025.1305%205.82345%2025.1305H4.99659Z%22%20fill%3D%22white%22%2F%3E%0A%3Cpath%20d%3D%22M15.9102%2020.1335H20.9304V23.2284H15.9102V20.1335ZM15.9928%2024.067H20.8359V35.7258H15.9928V24.067Z%22%20fill%3D%22white%22%2F%3E%0A%3Cpath%20d%3D%22M21.9707%2032.4067V32.3595C21.9707%2030.0325%2023.6953%2028.7331%2026.4121%2028.7331C27.3925%2028.7331%2028.6565%2028.9457%2029.1644%2029.1584V28.9694C29.1644%2027.9063%2028.5029%2027.2802%2027.0145%2027.2802C25.8215%2027.2802%2024.8175%2027.5401%2023.7898%2027.9417L22.9393%2024.7169C24.2859%2024.209%2025.8215%2023.8665%2027.8532%2023.8665C30.2275%2023.8665%2031.7631%2024.3626%2032.7789%2025.3784C33.6531%2026.2525%2033.9956%2027.3865%2033.9956%2029.0757V35.7142H29.1526V34.5448C28.3375%2035.4189%2027.2508%2035.9977%2025.7979%2035.9977C23.5535%2035.9977%2021.9825%2034.7219%2021.9825%2032.4067H21.9707ZM29.1998%2031.4027V30.9066C28.9281%2030.8003%2028.4911%2030.7176%2028.0895%2030.7176C27.1327%2030.7176%2026.6011%2031.2964%2026.6011%2032.0169V32.0642C26.6011%2032.7493%2027.0972%2033.1982%2027.7115%2033.1982C28.562%2033.1982%2029.1998%2032.513%2029.1998%2031.4027Z%22%20fill%3D%22white%22%2F%3E%0A%3Cpath%20d%3D%22M35.4365%2024.0671H40.2796V25.6263C41.0237%2024.6695%2042.205%2023.7954%2043.7996%2023.7954C45.3943%2023.7954%2046.5991%2024.4805%2047.237%2025.7208C48.2174%2024.6105%2049.3868%2023.7954%2051.1823%2023.7954C53.6747%2023.7954%2055.2221%2025.4137%2055.2221%2028.0478V35.7258H50.3791V29.5598C50.3791%2028.5794%2049.8003%2028.0242%2049.1033%2028.0242C48.4064%2028.0242%2047.7567%2028.5794%2047.7567%2029.5598V35.7258H42.9137V29.5598C42.9137%2028.5794%2042.3349%2028.0242%2041.638%2028.0242C40.941%2028.0242%2040.2914%2028.5794%2040.2914%2029.5598V35.7258H35.4483V24.0671H35.4365Z%22%20fill%3D%22white%22%2F%3E%0A%3Cpath%20d%3D%22M56.3086%2029.9379V29.8906C56.3086%2026.6068%2059.0372%2023.7837%2062.8762%2023.7837C66.7152%2023.7837%2069.4084%2026.5596%2069.4084%2029.8434V29.8906C69.4084%2033.1745%2066.6798%2035.9976%2062.8408%2035.9976C59.0018%2035.9976%2056.3086%2033.2217%2056.3086%2029.9379ZM64.7662%2029.9379V29.8906C64.7662%2028.733%2063.9157%2027.8235%2062.8408%2027.8235C61.7659%2027.8235%2060.9626%2028.7449%2060.9626%2029.8552V29.9025C60.9626%2031.0601%2061.8131%2031.9696%2062.888%2031.9696C63.963%2031.9696%2064.7662%2031.0482%2064.7662%2029.9379Z%22%20fill%3D%22white%22%2F%3E%0A%3Cpath%20d%3D%22M70.5898%2024.0672H75.4329V25.6855C76.1771%2024.7287%2077.3583%2023.7837%2079.0002%2023.7837C81.4572%2023.7837%2082.9927%2025.402%2082.9927%2028.0361V35.7141H78.1497V29.5835C78.1497%2028.5795%2077.5473%2028.0007%2076.8267%2028.0007C76.1062%2028.0007%2075.4447%2028.5795%2075.4447%2029.5835V35.7141H70.6017V24.0554L70.5898%2024.0672Z%22%20fill%3D%22white%22%2F%3E%0A%3Cpath%20d%3D%22M84.1036%2029.9732V29.9259C84.1036%2026.2287%2086.3243%2023.7835%2089.0766%2023.7835C90.8484%2023.7835%2091.8288%2024.5513%2092.573%2025.3782V20.1335H97.416V35.7139H92.573V34.2847C91.7816%2035.1351%2090.8839%2035.9856%2089.112%2035.9856C86.2889%2035.9856%2084.0918%2033.5287%2084.0918%2029.9614L84.1036%2029.9732ZM92.6793%2029.9141V29.8669C92.6793%2028.7211%2091.8525%2027.7761%2090.7421%2027.7761C89.6317%2027.7761%2088.8049%2028.6974%2088.8049%2029.8669V29.9141C88.8049%2031.0835%2089.6317%2032.0049%2090.7421%2032.0049C91.8525%2032.0049%2092.6793%2031.0835%2092.6793%2029.9141Z%22%20fill%3D%22white%22%2F%3E%0A%3Cpath%20d%3D%22M103.806%2034.391V35.7139H98.9629V20.1335H103.806V25.4963C104.597%2024.6458%20105.495%2023.7954%20107.267%2023.7954C110.078%2023.7954%20112.287%2026.2523%20112.287%2029.8078V29.8551C112.287%2033.5523%20110.066%2035.9974%20107.314%2035.9974C105.542%2035.9974%20104.562%2035.2296%20103.818%2034.4028L103.806%2034.391ZM107.586%2029.9141V29.8669C107.586%2028.6974%20106.759%2027.7761%20105.649%2027.7761C104.538%2027.7761%20103.711%2028.6974%20103.711%2029.8669V29.9141C103.711%2031.0717%20104.538%2032.0049%20105.649%2032.0049C106.759%2032.0049%20107.586%2031.0835%20107.586%2029.9141Z%22%20fill%3D%22white%22%2F%3E%0A%3Cpath%20d%3D%22M113.02%2032.4067V32.3595C113.02%2030.0325%20114.744%2028.7331%20117.461%2028.7331C118.441%2028.7331%20119.705%2028.9457%20120.213%2029.1584V28.9694C120.213%2027.9063%20119.552%2027.2802%20118.063%2027.2802C116.87%2027.2802%20115.866%2027.5401%20114.839%2027.9417L113.988%2024.7169C115.335%2024.209%20116.87%2023.8665%20118.902%2023.8665C121.276%2023.8665%20122.812%2024.3626%20123.828%2025.3784C124.702%2026.2525%20125.044%2027.3865%20125.044%2029.0757V35.7142H120.201V34.5448C119.386%2035.4189%20118.3%2035.9977%20116.847%2035.9977C114.602%2035.9977%20113.031%2034.7219%20113.031%2032.4067H113.02ZM120.26%2031.4027V30.9066C119.989%2030.8003%20119.552%2030.7176%20119.15%2030.7176C118.193%2030.7176%20117.65%2031.2964%20117.65%2032.0169V32.0642C117.65%2032.7493%20118.146%2033.1982%20118.76%2033.1982C119.611%2033.1982%20120.249%2032.513%20120.249%2031.4027H120.26Z%22%20fill%3D%22white%22%2F%3E%0A%3Cpath%20d%3D%22M126.131%2029.9496V29.9024C126.131%2026.6422%20128.694%2023.7954%20132.486%2023.7954C135.049%2023.7954%20136.856%2025.1184%20137.754%2027.0202L134.281%2028.981C133.88%2028.2368%20133.36%2027.8116%20132.58%2027.8116C131.553%2027.8116%20130.785%2028.7093%20130.785%2029.8551V29.9024C130.785%2031.119%20131.553%2031.9931%20132.509%2031.9931C133.36%2031.9931%20133.856%2031.5679%20134.329%2030.8237L137.849%2032.8318C136.797%2034.769%20135.026%2036.0093%20132.261%2036.0093C128.718%2036.0093%20126.143%2033.2098%20126.143%2029.9496H126.131Z%22%20fill%3D%22white%22%2F%3E%0A%3Cpath%20d%3D%22M138.676%2020.1339H143.519V27.6465L146.011%2024.0556H151.28L147.63%2028.7923L151.339%2035.7025H146.153L144.464%2032.5013L143.507%2033.7416V35.7025H138.664V20.1221L138.676%2020.1339Z%22%20fill%3D%22white%22%2F%3E%0A%3Cpath%20d%3D%22M150.831%2034.3084L152.473%2031.5562C153.879%2032.4303%20155.461%2032.8555%20156.784%2032.8555C157.257%2032.8555%20157.493%2032.7492%20157.493%2032.4775V32.4303C157.493%2032.194%20157.281%2032.0523%20156.099%2031.7452C153.158%2031.0246%20151.339%2030.2332%20151.339%2027.8235V27.7762C151.339%2025.213%20153.383%2023.7837%20156.418%2023.7837C158.344%2023.7837%20160.234%2024.2798%20161.651%2025.1303L160.116%2028.0125C158.875%2027.3274%20157.387%2026.9258%20156.406%2026.9258C155.934%2026.9258%20155.721%2027.0557%20155.721%2027.2919V27.3392C155.721%2027.5754%20155.981%2027.7172%20157.151%2028.0243C160.092%2028.7448%20161.864%2029.5599%20161.864%2031.946V31.9932C161.864%2034.5329%20159.962%2036.0094%20156.808%2036.0094C154.54%2036.0094%20152.497%2035.4306%20150.831%2034.3202V34.3084Z%22%20fill%3D%22white%22%2F%3E%0A%3Cpath%20fill-rule%3D%22evenodd%22%20clip-rule%3D%22evenodd%22%20d%3D%22M171.368%204.36764C177.191%20-1.45588%20186.632%20-1.45588%20192.456%204.36764C198.279%2010.1912%20198.279%2019.6324%20192.456%2025.4559L181.912%2036L171.368%2025.4559C165.544%2019.6324%20165.544%2010.1912%20171.368%204.36764ZM174.009%207.55761C173.948%207.86849%20173.916%208.39718%20173.916%209.14566V10.4189C173.916%2011.1832%20173.948%2011.7198%20174.013%2012.0267C174.078%2012.3317%20174.278%2012.6168%20174.617%2012.8762C174.956%2013.1376%20175.403%2013.3316%20175.958%2013.4623C176.512%2013.593%20177.1%2013.6584%20177.837%2013.6584C178.573%2013.6584%20179.217%2013.591%20179.769%2013.4524C180.322%2013.3158%20180.761%2013.1178%20181.086%2012.8604C181.411%2012.6029%20181.605%2012.3178%20181.666%2012.0069C181.728%2011.6961%20181.759%2011.1674%20181.759%2010.4189V9.14566C181.759%208.38134%20181.728%207.84473%20181.662%207.53781C181.597%207.23287%20181.397%206.94971%20181.058%206.68834C180.72%206.42696%20180.272%206.23291%20179.718%206.10223C179.163%205.97154%20178.536%205.90619%20177.839%205.90619C177.102%205.90619%20176.459%205.97352%20175.906%206.11213C175.352%206.24875%20174.914%206.44677%20174.589%206.70418C174.265%206.9616%20174.071%207.24673%20174.009%207.55761ZM179.276%2024.8638C182.876%2024.8638%20184.557%2024.2064%20184.557%2021.862V21.858V21.3155C184.557%2019.6581%20183.516%2018.971%20180.252%2018.3136C179.278%2018.1136%20178.908%2017.9136%20178.908%2017.3136V16.9414C178.908%2016.6543%20179.177%2016.5117%20179.413%2016.5117C179.749%2016.5117%20179.918%2016.7137%20179.918%2016.9414V18.1136H184.391V17.3988C184.391%2015.4563%20183.347%2014.4266%20179.177%2014.4266C176.15%2014.4266%20173.896%2015.3414%20173.896%2017.3711V17.7433C173.896%2019.5155%20174.805%2020.3155%20178.201%2021.0303C178.28%2021.0472%20178.355%2021.063%20178.427%2021.0781C179.329%2021.2674%20179.647%2021.3341%20179.647%2021.9174V22.2897C179.647%2022.6619%20179.546%2022.8045%20179.142%2022.8045C178.67%2022.8045%20178.637%2022.5471%20178.637%2022.262V21.2897H173.894V21.7471C173.894%2024.149%20175.476%2024.8638%20179.276%2024.8638ZM185.424%2024.5569H189.925V14.7355H185.424V24.5569ZM186.955%2013.5019H189.925V6.06064H187.092V9.411L185.193%206.06064H182.359V13.5019H185.193V10.1199L186.955%2013.5019ZM178.269%2012.152C178.204%2012.2688%20178.055%2012.3262%20177.825%2012.3262L177.827%2012.3282C177.604%2012.3282%20177.459%2012.2767%20177.398%2012.1758C177.336%2012.0748%20177.305%2011.8074%20177.305%2011.3758V7.90068C177.305%207.51852%20177.352%207.28684%20177.445%207.20962C177.538%207.13239%20177.675%207.09279%20177.851%207.09279C178.059%207.09279%20178.198%207.14031%20178.265%207.23734C178.332%207.33239%20178.366%207.55416%20178.366%207.90068V11.3203C178.366%2011.7579%20178.334%2012.0352%20178.269%2012.152Z%22%20fill%3D%22white%22%2F%3E%0A%3C%2Fg%3E%0A%3Cdefs%3E%0A%3CclipPath%20id%3D%22clip0_15229_1365%22%3E%0A%3Crect%20width%3D%22197%22%20height%3D%2237%22%20fill%3D%22white%22%2F%3E%0A%3C%2FclipPath%3E%0A%3C%2Fdefs%3E%0A%3C%2Fsvg%3E%0A)
Can the Diamondbacks Stave Off Regression?

The Diamondbacks have had an excellent first half of the season. Any way you look at it, the team has exceeded expectations. The second half of last season offered a glimpse into their potential as young players arrived and excelled. Heading into 2023 however the pre season projections from most statistical websites, along with the betting lines on most gambling sites viewed Arizona as somewhere in the vicinity of a .500 team.
To date they are 52-39, in a virtual tie for first place in the NL West with the 51-38 Dodgers, and behind by just .002 percentage points (.573 vs .571). Their current position in the National League playoff race therefore is still that of a Wild Card team. They're a half game behind the Marlins in the second wild card spot and are just 3.0 games clear of the Phillies and Brewers from dropping out of a playoff position. Full Standings page
The question on everybody's mind is can they sustain this pace and make the playoffs in 2023? It can't be stated enough that if they were to do so it would be an incredible accomplishment. As we've discussed before, teams almost never come back this quickly from a season such as the one they had in 2021. But expectations have been raised, and so we need to look closely under the hood to get a feel for where things might be headed. In truth, there are many signs that some regression is coming.
Recent Game Results
On June 12th the team had just beaten the Phillies in the opener of a four-game series for their sixth win in a row. That put them at 41-25. They lost the next three games of that series, starting an up and down stretch where they've gone 11-14 in their last 25 games. That includes going 4-7 over their last 11 while scoring just 2.9 runs per game and batting .202 with a .619 OPS. Prior to this team wide slump they were scoring 5. 2 runs, batting .265 with a .772 OPS. Clearly that level wasn't sustainable, but just how much were they over performing?
Expected Statistics
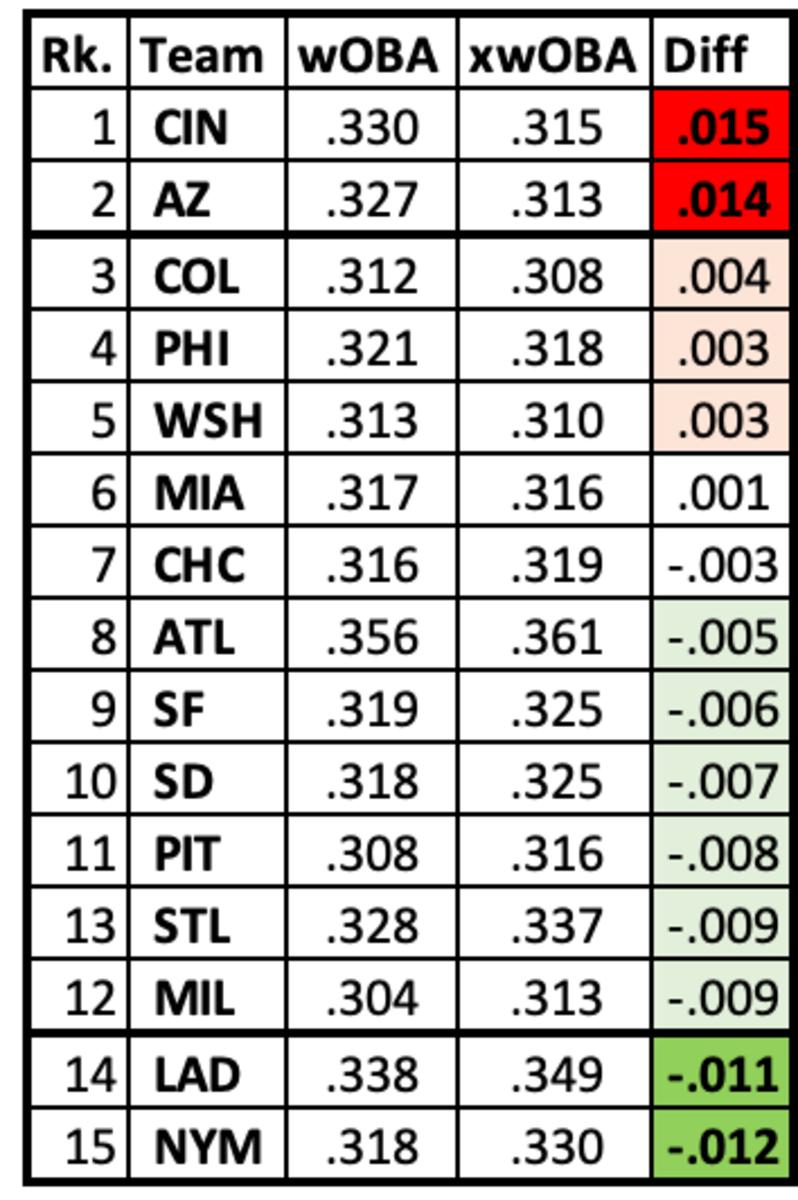
Baseball Savant provides expected batting metrics based on the quality of contact, notably exit velocity and launch angle to provide xBA (expected batting average) and xSlug. Those are combined with actual walks and strikeouts to create a catchall offensive metric called xwOBA, or expected weighted on base average. While there can be a some pretty large outlier results depending on the individual hitter and their batted ball profile, on a team wide basis large variances between expected and actual batting should be noted.
The top two over performing, (or luckiest) teams in the National League are the Cincinnati Reds and the Diamondbacks. (.15 and .14 wOBA over xwOBA respectively) On the flip side the two most underperforming, or unluckiest teams are the Mets and the Dodgers. These expected metrics are far from infallible measures, but they are data points that should be heeded at the extremes. In fact a couple of weeks ago the D-backs had a difference of nearly +.20. As we've seen in recent results, some of the regression to the mean has already started.
On and individual level the three hitters whose results are the highest compared to their expected are all stars Geraldo Perdomo (+.67), Corbin Carroll (+.43), and Lourdes Gurriel Jr. (+.27)
Pitching Depth
Despite the excellent performances of Zac Gallen and Merrill Kelly, the overall picture for the rotation has been below average for most of the season. Even after saying good bye to Madison Bumgarner early in the season, inconsistency among the remaining starters remains. The starting pitcher ERA is 4.61 and ranks 12th in the NL.
Zach Davies was signed to provide innings and depth, but has made just 11 starts and has a 1-5 record with a 6.37 ERA. He's been somewhat better of late, but he's just not been able to provide the stability that general manager Mike Hazen was looking for when he re-signed him.
Young starters Tommy Henry and Ryne Nelson have been up and down this season, as should be expected of such inexperienced pitchers. Henry has 121 career MLB innings, 74 this year plus 21 in Reno for a total of 95. Nelson has 112 career MLB innings, 94 of them coming this year. Last year majors and minors combined Henry threw 160 innings and Nelson 154. How deep into the season they'll be able to get before they tire is a question that is on Hazen's mind. He mentioned this on a radio interview in the context of looking for more pitching at the trade deadline.
Schedule
As detailed by Michael McDermott earlier today, the D-backs have the toughest second half schedule of any contending NL team. They come out of the All-Star break to play a nine game road trip, three each against the Blue Jays, Braves and Reds. All three teams have over 50 wins and are in a playoff spot. How that road trip goes, and the subsequent six-game home stand against the Cardinals and Mariners will determine just how aggressive Hazen will be at the trade deadline.
Summary
Utilizing composite projections from Baseball Reference, Baseball Prospectus, Fan Graphs, and Five Thirty Eight, the D-backs are projected to go 35-36 the rest of the way, ending up 87-75. Their current post season odds are 59%. Essentially that is a coin flip's chance to make the post season. The Phillies made it in last year with 87 wins, but that is right on the razor's edge.
None of the above is a prediction or to say the D-backs are doomed to fail or anything like that. They have been resilient and have a lot of talent and a great coaching staff. The games are played on grass and dirt, not on paper, and this team has surprised us for much of the year. If Hazen is able to pull off a couple of trades that bolster the team for the stretch run, then their odds may improve. Of course other top teams are also looking to add at the deadline. Who makes the best moves and gets the best results remains to be seen.

Jack Sommers is the Publisher and credentialed beat writer for Arizona Diamondbacks ON SI. He's also the co-host of the Snakes Territory Podcast and Youtube channel. Formerly a baseball operations department analyst for the D-backs, Jack also covered the team for MLB.com, The Associated Press, and SB Nation. Follow Jack on Twitter @shoewizard59