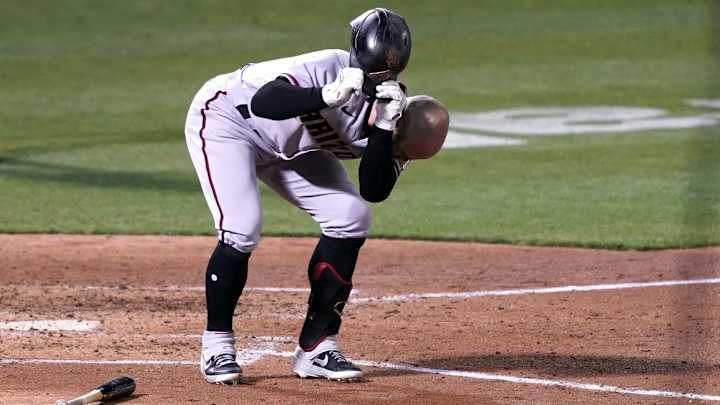
The D-backs Hitters are Suddenly Striking Out A Lot

Over the last four games the Diamondbacks strikeouts have jumped at an alarming rate. Through May 15th the D-backs had only struck out 10 times or more six times in 42 games, and had never done that two games in a row. Over their past four games however they've struck out 13, 11, 11, & 12 times.
The D-backs hitters went into play on May 16th having struck in just 19.6% of their plate appearances. That ranked 2nd in MLB for the lowest strikeout percentage and was much better than the MLB average 22.7 strikeout rate. They also ranked 2nd in batting average, hitting .270, behind on the Tampa Bay Rays. After those four games however the team strikeout percentage jumped to 20.4% and their rank in MLB dropped to 5th. How concerned should the team be about that?
That low strikeout percentage is a key part of their team success. By putting he ball in play more than almost any other team they've been able to leverage their speed and ability to hit line drives. (They also rank high in LD%, 6th overall) Not surprisingly however, the strikeout increase was accompanied by a drop in batting average over the last 4 games, as they hit just .222/.299/.409. , .709 OPS. The team batting average is now .266 and ranks 4th in the league.
The last two games have been against a good Pittsburgh Pirates pitching staff, one of the best in the league, but the prior two games to that were against the Oakland A's, who not only rank last in MLB in every pitching category, but have been historically bad. This sudden increase in strikeouts can't just be brushed off as facing tough pitching.
The strikeouts have been spread around during these past four games. Christian Walker, Dominic Fletcher, and Geraldo Perdomo have struck out six times each. Josh Rojas, Pavin Smith, and Evan Longoria have K'd four times a piece, (Longoria in just four trips to the plate). Five other players have struck out three times.
While it may seem premature to worry about a four game spike in strikeouts, it's a blip that is worth keeping an eye on to see if it develops into a trend. Is it the canary in the coal mine? There are some Statcast based metrics on Baseball Savant's website called "Expected Statistics" that suggest the D-backs have been one of, if not the "luckiest" teams in the league. Here is their explanation of these stats
Expected Outcome stats help to remove defense and ballpark from the equation to express the skill shown at the moment of batted ball contact. By looking at the exit velocity and launch angle of each batted ball, a Hit Probability is assigned based on the outcomes of comparable historic balls in play. By accumulating the expected outcomes of each batted ball with actual strikeouts, walks and hit by pitches, Expected Batting Average (xBA), Expected Slugging (xSLG), and (most importantly) Expected Weighted On-Base Average (xwOBA) tell the story of a player's season based on quality of and amount of contact, not outcomes.
While the team batting average of .266 currently ranks 4th in MLB, their xBA (expected BA) is just .250 and ranks 13th. The 16 point difference between actual and expected is the fourth largest difference in the league.
Arizona's .435 slugging % ranks 7th in the league, but their xSlg is just .395. That whopping 40 point difference is the biggest gap in MLB. The team wOBA is .332, but the xwOBA is just .315. That 17 point difference is again the biggest difference in the league.
So are the Diamondbacks destined to regress towards their expected statistics? The answer is not completely straight forward. In most years of the Statcast era, (since 2015) the biggest gaps between actual and expected numbers at the team level are usually about 10-15 points. (In either direction, over or under) The exception is the Colorado Rockies who in almost every full season have the biggest gap of over performance compared to expected statistics, often times by 20 percentage points or more. This is almost certainly tied to the fact that at 5000 feet elevation pitches don't break like they do in other ballparks. Setting Colorado aside however, it's atypical for a team's expected stats to vary more than 10-15 points from their actual.
We should expect the gap between expected and actual results to shrink for the Diamondbacks, but it's important to remember this is a young team and the expected metrics are not static. Young teams often improve, and the inputs that determine these expected stats could get better. The D-backs are unlikely to improve their already low strikeout rate, but the walk rate has been rising since the first week of the season. They hit the ball on the ground a lot too. Lowering their ground ball rate would result in a higher average launch angle, and contribute to improved expected stats. In other words, not all of the regression needs to come from the actual batting numbers getting worse. The expected numbers could get better too.
Two players that have the biggest negative gaps between their actual and expected results are Jake McCarthy and Alek Thomas, and both got optioned to Triple-A Reno. The players outperforming their expected metrics the most are Geraldo Perdomo and Dominic Fletcher. View Table here
Where things go from here is impossible to say with any certainty. While it's likely the team batting numbers will come down somewhat, just how much they drop, or if they drop at all, is something we will continue to monitor and report on as it happens.
