Which Diamondbacks Have Over or Under Produced Projections the Most?

Heading into the 2024 season, the Arizona Diamondbacks were projected to win 84.4 games and have a .521 win percentage, according to the playoff odds report at FanGraphs.
Those projections are based on thousands of simulations run off individual player projections derived from ZiPS and Steamer projection systems.
It's important to note that the D-backs certainly have their proprietary projections they use to plan their roster construction and budget allocation. It's likely their in-house projections weren't (or shouldn't have been) too far off the public systems in the aggregate.
Through 78 games, the D-backs are 38-40, .487 W%. The difference in a .521 W% and .487 W% works out to -2.6 fewer wins than expected heading into the season.
A combination of injuries and under-performance by some key players has outweighed the production the team has gotten from players who have exceeded their projections. We can see this by comparing the pre-season WAR projections with the prorated through 78 games actual production.
First we'll look at this at the team level. Note that the -2.5 difference between projected and actual WAR is almost exactly the same as the difference in the number of wins the team has.
The position players as an entire group have outproduced their projections, while the pitchers, especially the starters, have underproduced. Note the projected WAR in all the tables below is prorated to 78 team games.
Diving into the individual player table posted several paragraphs below we can see which players have had the greatest positive and negative impact.
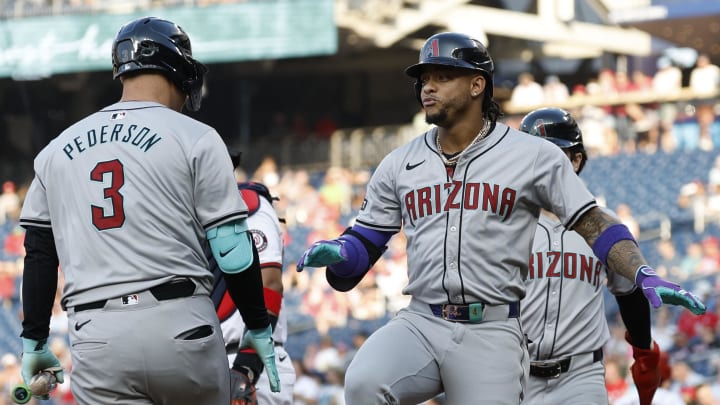
Ketel Marte is having an All-Star and MVP caliber season. Joc Pederson has had a terrific first half as the left-handed DH. Christian Walker has defied his age-related projected decline to keep his numbers up to previous years' levels.
These positive developments have more than offset the negative impacts from Corbin Carroll's sophomore slump and Eugenio Suarez' collapse at the plate.
Jake McCarthy's excellent season has more than offset the loss of Alek Thomas for the entire season and Kevin Newman's stellar defense and better than expected offense more than made up for Geraldo Perdomo missing over two months.
Moving on to the starting pitching, to nobody who follows the team closely's surprise, this is the area where the team has struggled the most. It's mostly due to injury of course, but also some underperformance.
Eduardo Rodriguez, signed to a four year, $80 million dollar contract, has not thrown a pitch this year. Merrill Kelly made just four starts. Both have shoulder injuries and both are unlikely to return before the July 30th trade deadline.
Zac Gallen has missed a month due to a hamstring injury, but is due to return this weekend if he had no ill effects from his most recent simulation game. Jordan Montgomery has pitched well below expectations.
Brandon Pfaadt is the only starter to exceed expecations in any meaningful way. The replacement starters such as Tommy Henry, Ryne Nelson and Slade Cecconi have not been able to pick up much if any of the slack unfortunately.
And finally, moving on to the bullpen, the loss of Paul Sewald for the first six weeks of the season was certainly a detriment to the D-backs' reliever core. WAR doesn't do a particularly great job of capturing reliever value sometimes though.
Note that pitcher WAR for Fangraphs is based on FIP, or Fielding Independent Pitching, and therefore does not take balls in play into account. It's strictly based on walks, strikeouts, and homers allowed to derive an expected run value value.
Conclusions
Mike Hazen has often said that you just can't predict how things are going to work out. The D-backs have won 2-3 games fewer than they were expected to by this point in the season. The majority of that deficit is due to injury in the starting rotation.
Going forward, the D-backs are going to need a bit of luck to not only get healthy in the rotation ASAP, but they'll also need to outperform their projections by at least a couple of wins over the second half of the season.
Barring an inordinate amount of luck in one-run games, just playing to their projections going forward will likely leave them on the outside looking in.
