What the 2015 Fumble Stats Say About Deflategate

By Michael Lopez
Assistant professor of statistics at Skidmore College
@StatsbyLopez
Last winter, much was made about the extremely low fumble rates of the Patriots, leading many to speculate or conclude that their potentially deflated footballs were responsible. See FiveThirtyEight for a general summary of the arguments.
In any case, the 2015 season makes for an excellent out-of-sample test with respect to New England's fumble tendencies. Although the Patriots have been accused of going crazy lengths to gain a winning edge, it seems safe to assume that any suspect ball routine could not have been a part of the game-day preparation process this season. (The NFL implemented new procedures for inspecting game balls.) As a result, if one initially made the link between the Patriots low fumble rates and deflated footballs, the natural follow-up would be to assume that New England's fumble rates would revert toward the league average in 2015.
So what happened in 2015?
• The Patriots had the fewest fumbles of any NFL offense.
• The Patriots had the best fumble rate of any NFL offense.
• The Patriots had one of their best fumble rates of the past decade.
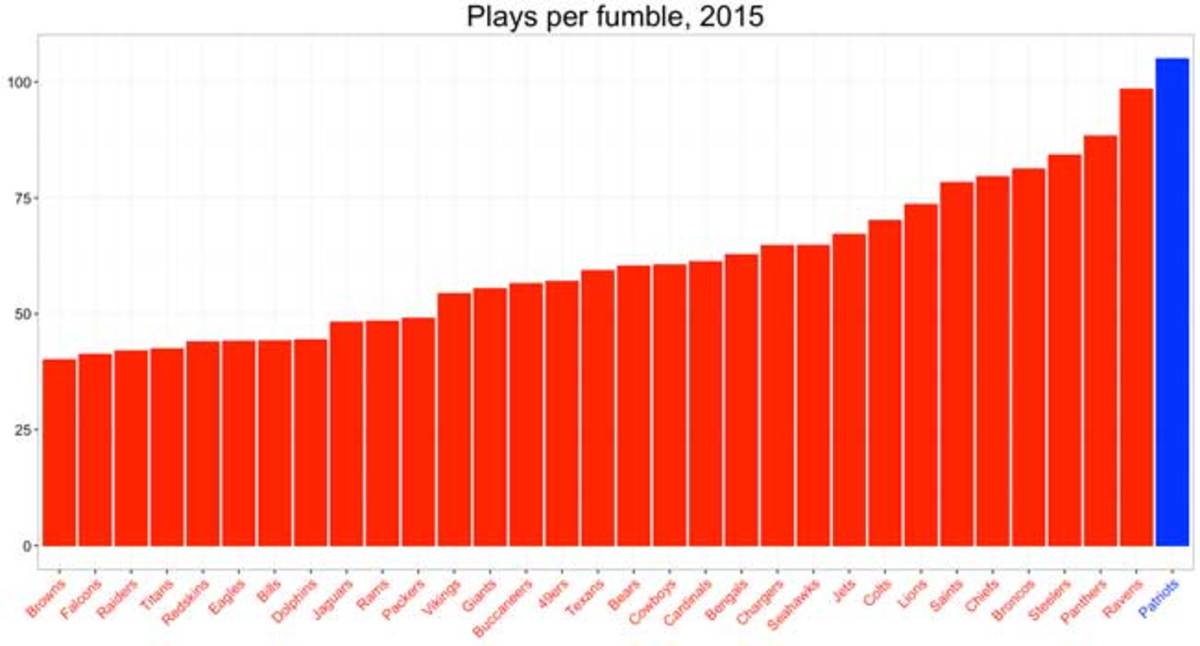
Here's a barplot of each offense's 2015 fumble rate. To match a previous author's chart, I'll use plays per fumble, which means that teams fumbling less often will have higher numbers. (Using the NFL's website, I grabbed the relevant offensive team information—fumbles and number of plays—and subtracted non-offensive team fumbles to ensure that fumbles using the ‘K’ balls weren't counted.)

That's the Patriots on the far right, leading the league while fumbling only once every 105 plays.
There are several explanations for their continued success of hanging on to the ball, none of which have to do with deflated footballs. As explained here, the Patriots have consistently led the league in plays that are associated with low fumble rates, including kneel downs, plays in opponent territory, and plays when holding a lead. Related, the Patriots, Broncos, and Panthers—three teams that went a combined 39-9 in 2015—finished first, fourth and fifth, respectively, in plays per fumble.
A link between low football PSI's and high fumble rates was never established by anyone, so a check of the 2015 data shouldn’t mean much as far as the likelihood of the Patriots cheating. But the information provides a nice confirmation to what Gregory Matthews and I wrote back in January: Statistics is hard, and this can lead to deception, either willful or otherwise.
The idea that the Patriots were a 1 in 16,000 type-of-outlier made for a nice story, and it was quite easy to use aggregated statistics that implicated New England. As often happens, however, there's more to data than meets the eye. In the case of fumble rates, New England has routinely led the league. It's a result that seems more likely to be accounted for by differences in points on the scoreboard, and not by differences in the pressure levels of footballs.
• Question? Comment?Let us know at talkback@themmbq.com
