How Likely Was the Chargers-Jets Shutout?

Keith Goldner
The Chargers blanked the Jets on Sunday for the first shutout of 2014. The Jets’ offense, led by Geno Smith then Michael Vick, was anemic—the team didn’t enter San Diego territory until late in the fourth quarter.
While the Chargers dominated on both sides of the ball, the Jets only turned it over twice (not including a late turnover on downs). New York punted eight times and had five drives that never gained positive yardage.
Should we have seen this coming? Entering the contest, what were the chances that this game would end in a shutout? And what were the chances the first shutout of the season wouldn’t come until Week 5?
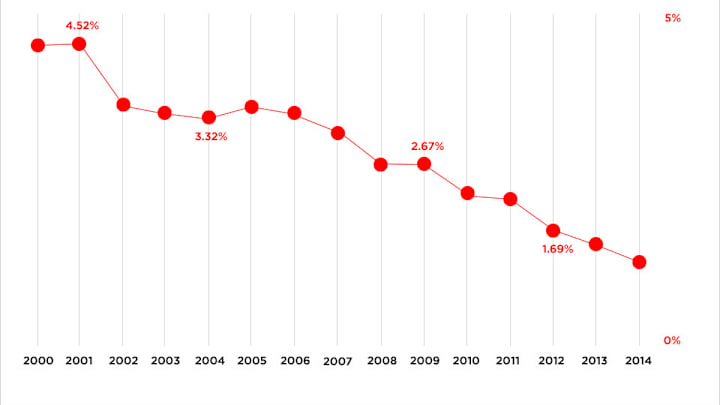
Because scoring in the NFL has increased dramatically since 2000 (41 points per game then, versus roughly 47 points per game in 2013), how have these probabilities changed over time?
To generate these odds, we calculated an estimated total points for each game using our internal metric, Net Expected Points (NEP). A quick refresher on NEP:
NEP compares every single play over a season to how a league-average team should perform on that play. Every situation on a football field has an expected point value; that is, how many points an average team would be expected to score in that situation (given down, distance-to-go and yard line). For example, the Chiefs may be playing the Steelers, facing a third-and-two on the 50. That’s a ton of variables, but numberFire has data from the past dozen years of every single play, so most situations have come up at least once. According to our data, an average team may be “expected” to score 1.23 (estimated number) points on that drive. However, Jamaal Charles reels off a 32-yard run to bring the Chiefs into the red zone, increasing the “expected” point value of the next play to 4.23 (still an estimated number) points. Jamaal Charles then gets credit for the difference, in this case 2.96 points, as his NEP total. That’s Net Expected Points.
In 2000 and 2001, we estimated 11.7 shutouts each year (there were 15 and 10, respectively). This year, we project just 3.4 shutouts for the entire season (there were three in 2013). All projections include postseason games.
Year | Expected Shutouts | Actual Shutouts |
|---|---|---|
2000 | 11.7 | 15 |
2001 | 11.7 | 10 |
2002 | 9.5 | 8 |
2003 | 9.2 | 12 |
2004 | 8.9 | 4 |
2005 | 9.3 | 7 |
2006 | 9.2 | 15 |
2007 | 8.3 | 5 |
2008 | 7.1 | 6 |
2009 | 7.1 | 11 |
2010 | 5.8 | 5 |
2011 | 5.7 | 5 |
2012 | 4.5 | 6 |
2013 | 4.1 | 3 |
2014 | 3.4 | 1 (through Week 5) |
In order for a shutout to be likely, there needs to be a large discrepancy in team talent (particularly a great defensive team and a terrible offensive team) and generally lower-scoring offenses.
Among the matchups through Week 5, Jets versus Chargers was the 13th-most likely to end in a shutout, with a 1.8% chance of it happening. The most likely shutout scenarios came from games involving the worst offenses in the NFL: Tampa Bay (3.2% versus St. Louis in Week 2), Jacksonville (2.6% versus San Diego in Week 4), and Oakland (2.3% versus New England in Week 3).
• ANALYTICS HUB: Read all of numberFire’s 2014 pieces for The MMQB.
Through Week 5, we expected to see 0.95 shutouts—essentially what has actually happened so far. Since shutouts are such a rare occurrence, though, there was a 38.3% chance we would not see any through five weeks. All told, the NFL’s first shutout of 2014 came when we would expect it—and from a fairly likely game.
Looking forward, the shutout alert in Week 6 doesn’t come from the Jets, even though they are heavy underdogs against Peyton Manning’s Broncos. Rather, it comes from the Chargers once again. Facing off against the Raiders, there’s a 1.9% chance of San Diego blanking Oakland to make it back-to-back shutouts.
Keith Goldner is the chief analyst at numberFire.com, the leading fantasy sports analytics platform. Follow him on twitter @keithgoldner.

