The Five Pillars of Quarterbacking: Grading 70 Years of QB Play
Since 1950, there have been 562 different NFL quarterbacks to throw at least 100 regular-season passes. That's 869,763 pass attempts, 6,046,384 yards, 37,390 touchdown passes, 33,272 interceptions, and 40,139 games played. In that time, the NFL quarterback has been perhaps the most scrutinized position in American professional sports.
What makes a quarterback great? Who are the leaders? Who are the scrubs? Who do you want in a big game? Who has the most impressive physical tools? The job performance of an NFL quarterback probably only trails United States presidents in extensive national coverage.
I've put all 70 years and nearly 900,000 pass attempts into one analysis and now present an analytical list of the most successful, talented, effective — perhaps even "best" — quarterbacks of all time.
When trying to evaluate over 70 years of quarterbacking at the same time, there are inherent roadblocks that present themselves. Perhaps the biggest factor is simply time. The era in which a quarterback plays has a massive influence on the box score numbers that he produces. Over the course of NFL history, as athletes pushed the limits of what humans are capable of on a football field, coaches also learned how to scheme up effective offensive plays, rules shifted to favor offensive success, and quarterbacks gained access to sophisticated tools for game-planning and scouting their opponents. These factors are most of the reasons why the NFL passing record book is littered with modern-day entries.
But while comparing raw statistical output across generations of quarterbacks is a fool's errand, one thing that remains comparable is the measure of how the quarterbacks performed against their own peers. I borrowed this concept from baseball, where statistics like ERA+ and OPS+ give a contextualized value based on the performance of the league as a whole. In football terms, it looks like this:
Completion Percentage Plus, or cmp+, takes a quarterback's completion percentage and gives it a value as it relates to the whole league's completion percentage. Exact league average values are rated 100 for being exactly 100% of league average. If the league had a 60% total completion percentage, a QB with a 60% completion percentage that year would have a 100 cmp+. If the QB had a 50% completion percentage that year, 50/60 is 0.83, so they would have an 83 cmp+. If they passed for 70% that year, 70/60 is 1.17 so they would have a 117 cmp+.
Hopefully that concept is understandable, because it is the key to the following observations.
Another roadblock in analyzing quarterback statistics is opportunity. The number of pass attempts directly impacts the total completions, yards, touchdowns, and interceptions. This is why rate stats are so important. If a quarterback throws the ball 50 times a game, he's going to shatter the box score output of someone who only threw 30 passes a game. But is the first one a better quarterback simply because he had more opportunities to throw? Obviously not. That's where the Five Pillars of Quarterbacking come into play: Completion percentage, touchdown percentage, interception percentage, adjusted yards per attempt, and yes, win percentage.
Completion percentage, like all football statistics, is not a one-player result. Completions require the player on the other end of the pass attempt to do their part and actually catch the pass. But the best quarterbacks will throw the most catchable balls, and over a large enough sample size receiver drops will fade into statistical insignificance, allowing a quarterback's accuracy to be pretty fairly judged by their completion percentage. Drew Brees is the poster boy for this concept with his legendary accuracy, as his career 67.7% completion percentage is first among all quarterbacks with over 2,000 pass attempts. Yes, depth of target also has a large part to play here, but we will get to that pillar in a bit. For now, this is pillar number one.
Pillar number two is touchdown percentage. This is a simple calculation of the number of touchdowns thrown out of the total number of passes thrown. A player like Lamar Jackson, who is the active career leader in touchdown percentage, shows off this pillar by throwing a ridiculously high percentage of passes for touchdowns. Jackson's career mark of 7.18% is comfortably in first ahead of Patrick Mahomes's 6.76% career mark among active players, and is a real boon to his case for being labeled as more than just a running quarterback. Jackson might not throw it as often, but when he does, there's a pretty decent chance it's going for six.
Pillar number three is the spiritual opposite of touchdown percentage, which of course would be interception percentage. The total number of interceptions out of the total number of passes thrown will give a good indication of interceptable passes thrown by the quarterback. Yes, we all know that the "turnover-worthy pass" has been a hot-button statistic in the analytics world lately, but quarterbacks are punished for balls that get intercepted due to their receivers tipping it up in the air or running the wrong route just as often as they get bailed out by a defender dropping an easy pick, so we are not going to give weight to alternate-reality versions of events on the field. Over time, if a quarterback is careless with the football, his interception percentage will show it. The career leaders in this category, minimum 1,000 pass attempts, are Aaron Rodgers (1.35%) and Patrick Mahomes (1.42%) which should tell you everything you need to know about this pillar's importance in evaluating quarterback play.
Pillar number four is the least-known statistic among the five, and that is adjusted yards per attempt. First, here's a breakdown from Pro Football Reference (where all of my data originated) explaining where this value comes from and how it was derived.
The formula behind AY/A is (pass yards + 20*(pass TD) - 45*(interceptions thrown))/(passing attempts).
The concept is easy enough to understand: it takes the traditional yards per attempt number and incorporates touchdown passes and interceptions to create a value metric for the yards gained. Where completion percentage lacks context for depth of target, this pillar grades on the average yards gained per throw, with a bonus for touchdowns and a penalty for interceptions. This is a very good indicator of elite quarterback play and is my preferred statistical measuring stick if I have to only use one value. But the pillars are not complete without perhaps the most controversial of the five, and that is...
Yes, winning percentage. I know, I know, wins are a team statistic, I'll be the first one to say that. No, they are not the most important stat and no, Trent Dilfer was not a better quarterback than Dan Marino just because he has a Super Bowl ring. I've never been a fan of judging a player by their championship victories, and it is extremely difficult for a good quarterback to will a team of 52 other men to victory all by himself. However, the quarterback is undeniably burdened with the most responsibility for the team's success, and he certainly plays as large of a role in the game's outcome as any other individual player. So while it should not be used as a be-all-end-all measuring stick for a quarterback's greatness, it has a rightful place among the Five Pillars.
To recap: we have completion percentage, touchdown percentage, interception percentage, adjusted yards per attempt, and winning percentage.
Now we can apply the earlier concept of cmp+ to all five pillars and get a quarterback's five era-adjusted values. I will use a random quarterback to show you how those numbers are calculated. Let's pick, oh I don't know, somebody, anybody... John Elway? Sure, he'll do.
You won't hear many people arguing that Elway was not an extremely talented quarterback and one of the top players to ever play the position. You might, however, hear that argument from people who take into account the context of his era and his underwhelming box score performances. One such argument can be found on the very first episode of It's Always Sunny in Chiefs Kingdom, where my co-host Austin and I lay Elway's mediocrity bare for all to see. At the heart of this argument are the same five pillars discussed above, so let's take a look at them.
Elway's career lasted from 1983 to 1998. In those 16 years, quarterbacks who have 100+ career pass attempts (so we are not counting trick plays by position players or backups that got a few random snaps) completed 131,596 total passes in 232,608 attempts, for a 16-year league completion percentage of 56.57%. John Elway for his career completed 4,123 passes out of 7,250 attempts, for a career completion percentage of 56.87% and a cmp+ of 100.52 (56.87/56.57). That value ranks 154th out of the 562 qualified quarterbacks.
The NFL threw 9,331 touchdowns in those 232,608 attempts, for a league TD% of 4.01%. Elway threw 300 touchdowns in 7,250 attempts, for a career TD% of 4.14% and a TD+ of 103.15 (4.14/4.01). That value ranks 146th out of the 562 qualified quarterbacks.
The NFL threw 8,440 interceptions in this same time period, for a league INT% of 3.63%. Elway threw 226 picks in 7,250 attempts, for a career INT% of 3.12% and an INT+ of 116.40 (INT+ is reversed to give a higher value to the lower percentage, so this would be the league's 3.63% divided by Elway's 3.12%). That value ranks 83rd out of the 562 qualified quarterbacks.
I'll save the column space on the math behind the league's AY/A from 1983-1998, but the NFL combined to rate 6.07 in those years, compared to Elway's career value of 6.52. That's an AYA+ of 107.40, good for 76th out of the 562 qualified quarterbacks.
Finally, the wins. A league-average winning percentage is, not surprisingly, 0.500, which means Elway's career win percentage of 0.639 gives him a Win+ of 127.80, 27th-best out of the 562 qualified quarterbacks.
This same analysis has been completed for all quarterbacks in the data set, and if you value all five pillars equally, you can get a composite ranking by adding up the five scores. Elway's five pillars of 154, 146, 83, 76, and 43 give him a total ranking value of 502, which is the 52nd-lowest of the 562 qualified quarterbacks. By this measure, using five era-adjusted metrics, John Elway is the 52nd-best quarterback of all time.
I know, that'll be hard for a lot of readers to take seriously. But you can only ignore his numbers for so long before you come to the conclusion that he did not separate himself from his peers to warrant top-10 consideration. Being a top-52 QB is still a very nice career! But there is plenty of evidence to suggest that his reputation is a product of myth-making as much as anything else.
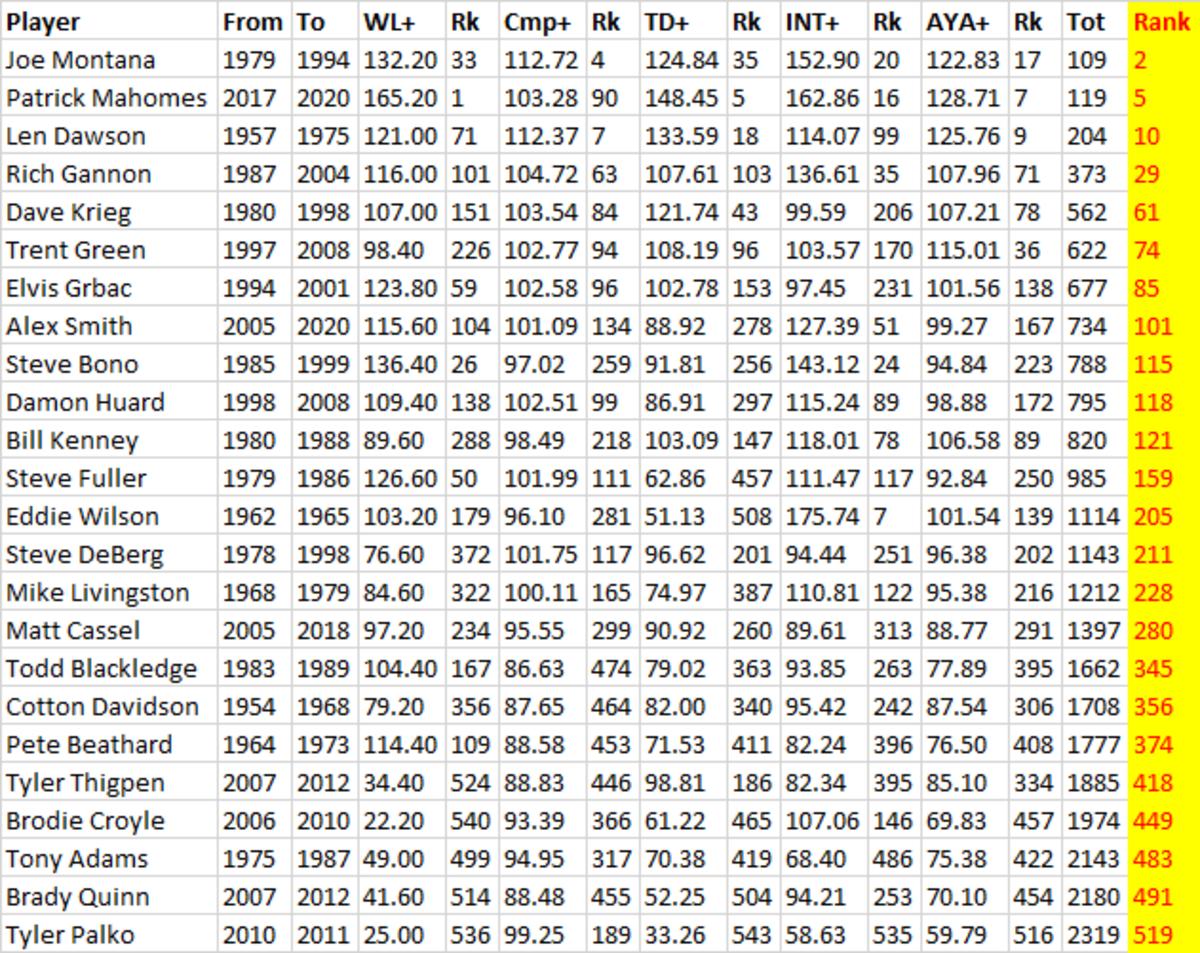
For Chiefs fans who are reading this, here's a chart of where every qualified QB who played for the Chiefs ranks using these metrics:

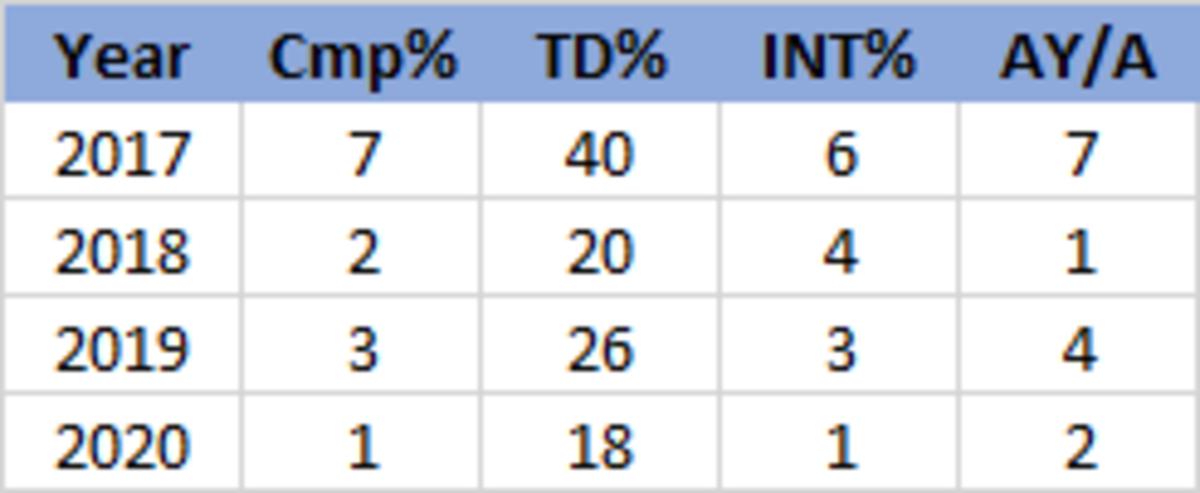
I expected to see Joe Montana and Len Dawson high up on the overall rankings (and Brodie Croyle, Brady Quinn and Tyler Palko towards the bottom) but what surprised me about this list was seeing Mahomes as the fifth-best era-adjusted quarterback of all time. His era, from 2017-2020, is made up of the best passing numbers the league has ever put up as a whole, which makes standing above the crowd that much more impressive. Here's where those four league years rank among all 70 seasons in the data:

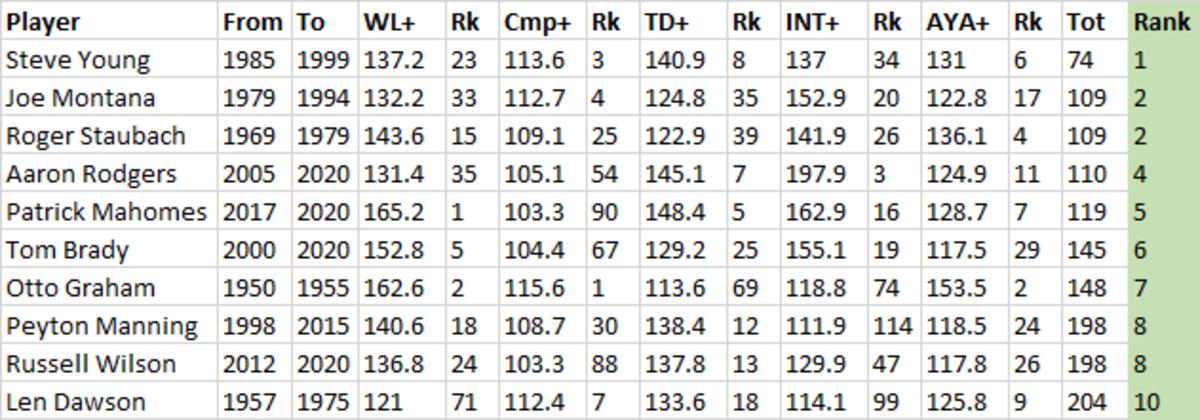
Mahomes has earned every bit of the generational talent reputation that he receives, and Chiefs fans know they are extremely lucky to have him under center for the next decade. But let's talk about some of the other players in the top 10 for a second. Here's that list:

Would you have guessed Steve Young as the number one ranked quarterback? If you followed his career closely, you might have. With top-10 finishes in cmp% (third), AY/A (sixth) and TD% (eighth), Young was a quarterback playing head and shoulders above his era. He began his career in 1985 when he went 3-16 with the Tampa Bay Buccaneers before being traded to the San Francisco 49ers, where he wouldn't become the full-time starter until 1991. However, if you adjust his career era to start from 1991 instead of 1985, he remains the number one era-adjusted quarterback. Young and Montana being first and second on this list is remarkable considering they spent six years on the same team.
Tom Brady makes for an interesting study here, as a majority of his "GOAT" reputation relates to postseason success, which this analysis does not account for. Instead, it shows that Brady is the sixth-best era-adjusted quarterback of all time, which feels correct. He's never been the most physically gifted quarterback, but his efficiency and intellect have been at an elite level since early in his career. Of course, his most elite pillar is still his win percentage (fifth) but he has certainly earned his place among the elite quarterbacks in NFL history, postseason or not.
Peyton Manning, who for my money is the best non-Mahomes quarterback I've ever seen play the game, checks in at number eight overall, tied with Russell Wilson, which is a bit of a disappointing finish for someone who was always three steps ahead of the opposing defense and holds the single-season records for yards and touchdowns. Where Manning really falls is his interception percentage, which ranks only 114th on the list and is responsible for over half of his total ranking. His 251 interceptions in 9,380 attempts gave him a career INT% of 2.68%, which isn't horrible by any means, but from 1998-2015 the league threw 304,497 passes and 9,115 of them were intercepted for a league INT% of 2.99%. That gives Manning only a 111.87 INT+ grade, which is the worst among the top-13 QBs.
Want to see more? Click here for a Google Sheets link to the full data.
No, spreadsheets and formulas will never replace watching these players with your own eyes. Yes, Elway fans will go to their graves talking about how he was an all-time great because "everyone who watched him says so," and that's fine. There will always be different ways to evaluate quarterback play. I think I've found a pretty solid grading system here, but it is not definitive. Just like United States presidents, the microscope never leaves the NFL quarterback.
