Big, Useful Data Says Outside Rushes are the New Market Inefficiency
The extremes of the NFL seem pretty set, as there wasn't much movement in the top or bottom five, while the battle for the playoffs in the middle ground rages on. How is your team looking through the lens of expected points?
(Reminder: Expected Points uses data from previous NFL seasons to determine how many points a team is likely to come away with on a given play, based on down, distance, time remaining, and field position. The difference in expected points at the start of a play and expected points at the end is referred to as expected points added, or EPA.)

San Francisco's defense has been incredible this year. They are miles ahead of most everyone else and yet, New England's defense is somehow twice as good as that. It's dumbfounding what this Patriots defense is doing. Of course one has to weigh the teams they've played, but even so, this is remarkable.
Houston's life in the top-3 was short lived, as they fell five spots after their 30-23 loss to Indianapolis. QB Jacoby Brissett had a career day against a struggling Texans defense, and that's the main reason they dropped so much. QB Deshaun Watson is still a top-5 passer by EPA/play, however, and he's the reason this team is still near the top of the board.
The Rams had a good day on both sides of the ball this week and hopped back into the top half of the league. Their opponents, the Falcons, lost the only good thing going for them when Matt Ryan left the game with an ankle injury in the fourth quarter. The Falcons defense is now the worst in the league by EPA, bumping Miami's defense out of the bottom spot for the first time this year.
Looking at EPA is the easiest way to see the downside of the run game. The average pass play in 2019 has resulted in +0.08 EPA for the offense, while the average run play has lost 0.08 EPA for the offense. But there's always more to it than just raw numbers. And most importantly, teams are going to run the ball regardless.
Something that is often lost in discussions in the analytics community is the analysis of how teams run the ball and how to define that using publicly available data. The NFL recently introduced its second Big Data Bowl with the goal being to enhance the evaluation of the run game without throwing shade at the specific decision to run the ball. Limited player tracking data for the 2017 & 2018 seasons was released to the public to analyze, including box counts, player locations, and even speed and acceleration. While there is a ton of stuff to do with this, I wanted to see how well we can look at the run game using publicly available data from nflscrapR to see if we can find some trends across even more seasons, and to see how 2019 is shaping up as well.
One idea that's already being used in the Big Data Bowl is looking at which direction runners are moving at the point they receive the hand-off. We can quantify the tendencies of runners to bounce it outside, as well as how successful they are in doing so. We don't know the runner's precise direction using publicly available data, but we do have fairly specific descriptions to work with. Each carry is given a description of the general direction a runner went. Those directions are:
- left end
- left tackle
- left guard
- up the middle
- right guard
- right tackle
- right end
Using this as a proxy for the direction a runner is heading, we can examine both how often and how successful each team is when running the ball towards a given area.
— Three-Sport Mathlete (@2SportMathlete) October 19, 2019
Baltimore currently has the best rushing offense by DVOA, as well as in most people's minds. From this chart we can see that they tend to run more often and successfully to the right side. Arizona, a team trying to bring the air raid offense into the NFL, somewhat surprisingly has a top-5 rushing attack by both DVOA and EPA/carry. And they do it in a far different way than Baltimore. The Cardinals rely almost exclusively on runs right up the middle. How is it that an air raid team is so successful at what a run-first, smash mouth team wants to do? They face lighter boxes. The Cardinals are running out three or more wide receivers on 67% of their offensive plays, and defensive personnel is largely dictated by the look the offense shows prior to each play.
When using this public data rather than player tracking data, we do run into some issues of scorekeeper bias. Each play description can be scored differently in different stadiums. What one play charter considers a run to the left guard, another might see as just a run up the middle. And we can see evidence of these very human tendencies specifically with two stadiums.
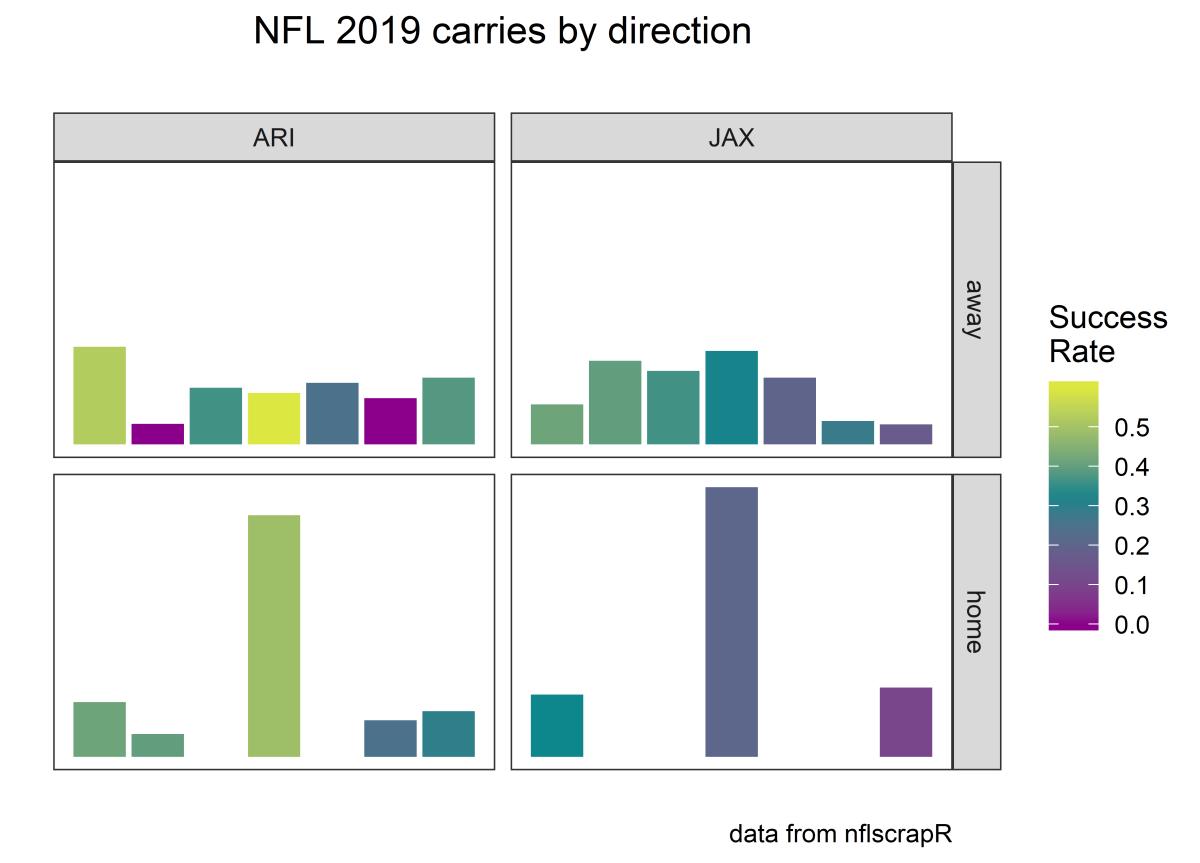
At home, unless a run play goes outside to an extreme, the play is scored as "up the middle." And yet on the road, both teams are suddenly very balanced with where they run the football. Is there a completely different running style on the road? Or are the home play charters keeping things a bit more simple and calling any run play that doesn't break outside the tackles a rush up the middle? I'm inclined to think the latter, though I must confess that I don't know the exact details with how the NFL's play-by-play system works. If there's a complicated algorithm that utilizes tracking data to spit out a play description, then that makes these splits even more confusing.
To adjust for this, I started looking at the last decade's worth of run plays in slightly less specific categories: runs up the middle (including the left & right guards) and runs to the outside (left & right tackles, left & right ends).
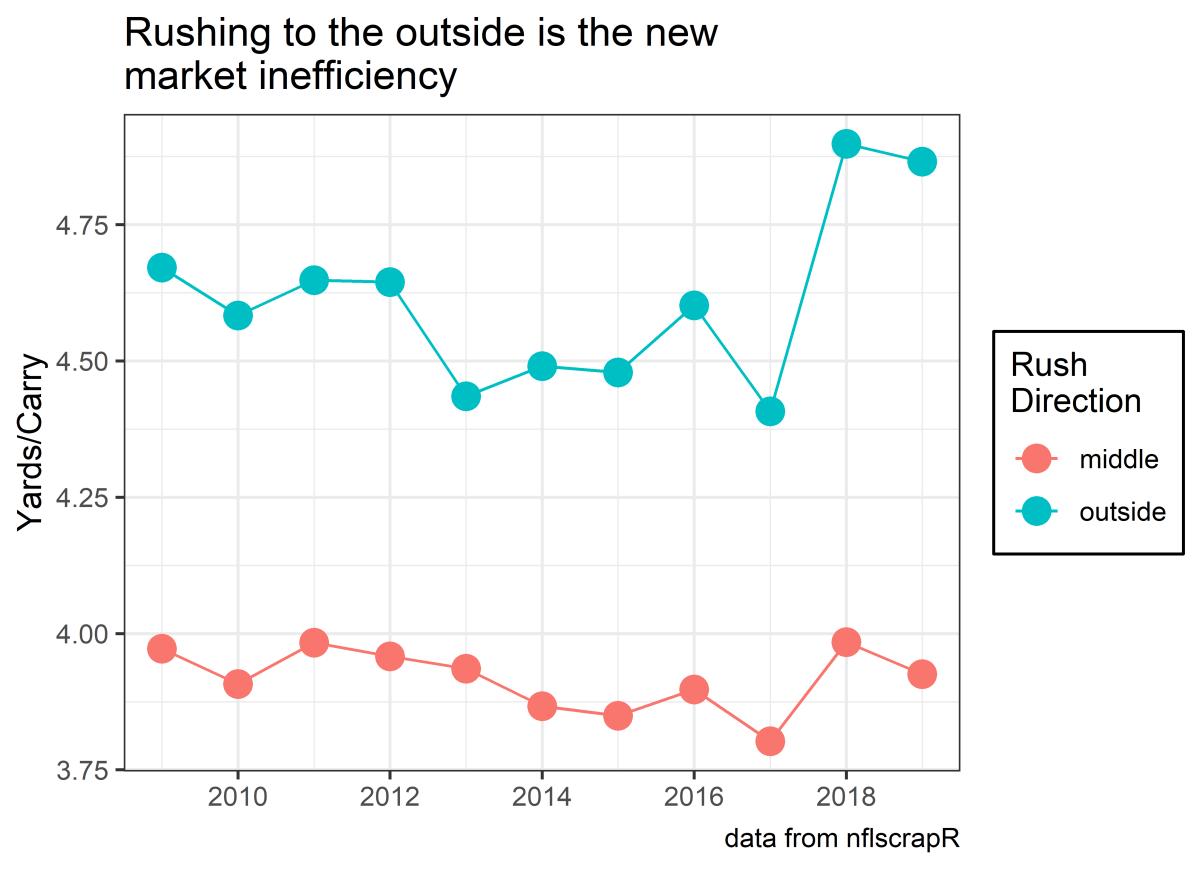
In 2018, we saw a pretty remarkable spike in the yards per carry on outside runs. And no, it wasn't just Todd Gurley and the Rams' fault. (Out of curiosity, I made the same chart excluding the 2018 Rams and it looks nearly identical to this one). But something that isn't captured in yards per carry is the context of a run play. Teams like to run up the middle in short yardage situations, while they aren't afraid to bounce it outside on an early down.
We can add some context by looking at success rate (the percentage of plays that gained a positive EPA) instead of yards per carry.
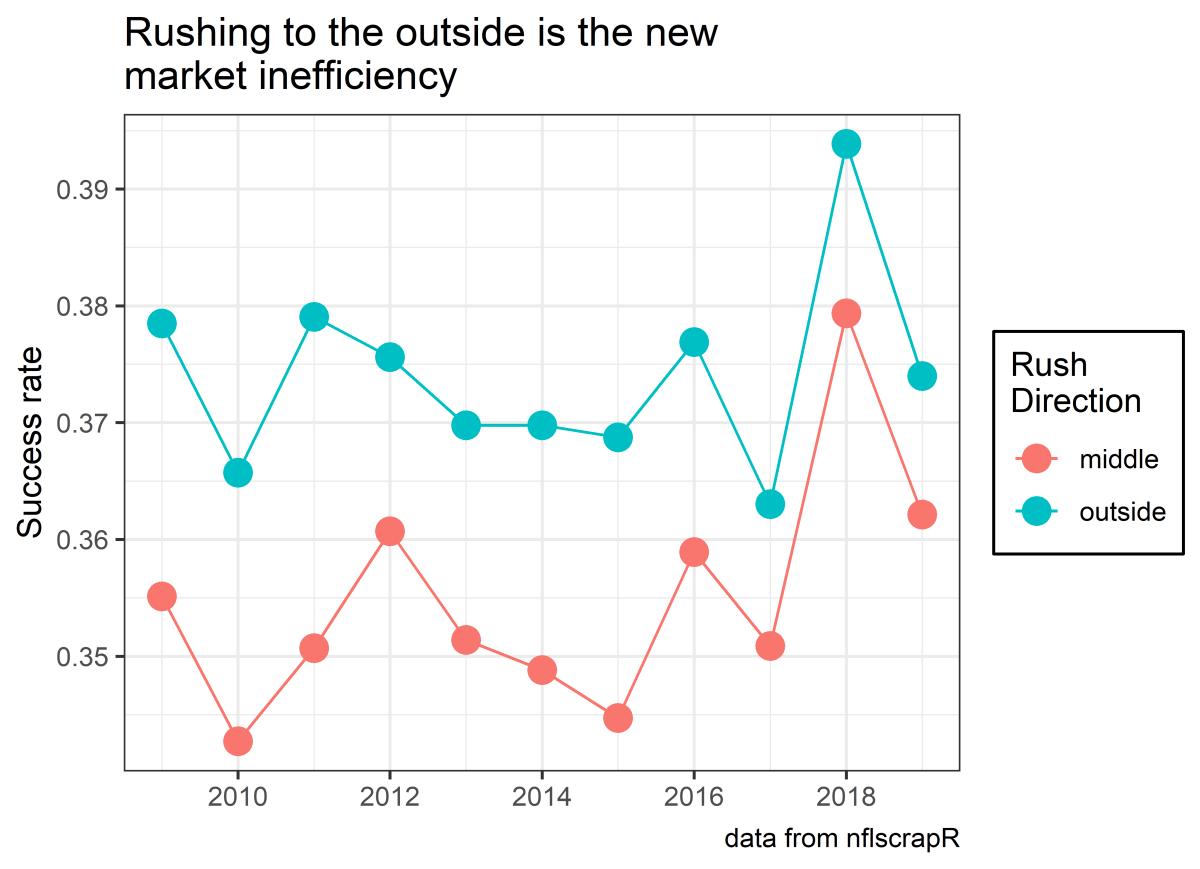
Again there's a spike in 2018, but this time rushes up the middle follow the same path.
As it turns out, rushing up the middle is nearly as successful as to the outside, and the difference in yardage is simply due to teams using straight ahead rushes more often in short-yardage situations.
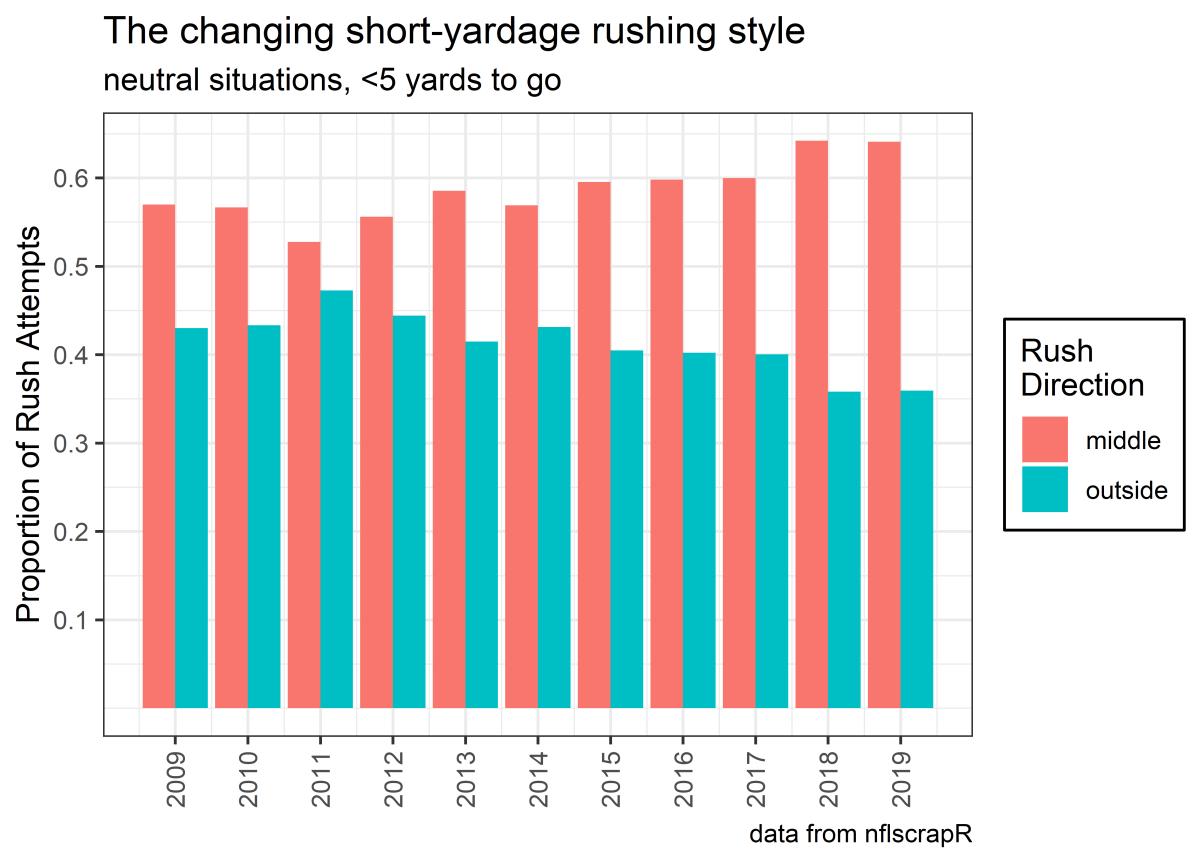
Restricting our data to neutral situations (win probability between 20% and 80%) and short yardage (less than 5 yards to go), we can see that running up the middle has actually become more popular almost every year since a near 50/50 split in 2011. And over the past four years, those carries up the middle have been more successful than their outside counterparts.

Success rate by direction flipped back and forth for years, but a large discrepancy between the two reared its head in 2015 and never looked back. In the league as a whole, running up the middle in short yardage has been the way to go. This year the tide might be turning as far as success goes, but teams are still feeding runs up the middle when looking for that first down.
Rushing is always going to be a part of the NFL, and we're really only scratching the surface of just how teams should be doing it.
