%22%3E%0A%3Cpath%20d%3D%22M0%205.36963H8.17912L17.4867%2016.9149V5.36963H26.1577V31.5274H18.3837L8.67102%2019.4612V31.5274H0V5.36963Z%22%20fill%3D%22white%22%2F%3E%0A%3Cpath%20d%3D%22M29.1385%205.36963H51.0331V12.8446H37.8771V16.1722H50.0975V22.9721H37.8771V31.5274H29.1289V5.36963H29.1385Z%22%20fill%3D%22white%22%2F%3E%0A%3Cpath%20d%3D%22M53.0869%205.36963H61.8351V24.0524H74.1327V31.5274H53.0966V5.36963H53.0869Z%22%20fill%3D%22white%22%2F%3E%0A%3Cpath%20d%3D%22M85.5146%205.36963H95.5263C105.914%205.36963%20111.113%2010.4912%20111.113%2018.2267V18.3038C111.113%2026.0393%20105.808%2031.5274%2095.2273%2031.5274H85.5146V5.36963ZM94.2628%2012.9893V23.898H95.7193C99.722%2023.898%20102.297%2022.2487%20102.297%2018.4774V18.4003C102.297%2014.629%2099.722%2012.9797%2095.7193%2012.9797H94.2628V12.9893Z%22%20fill%3D%22white%22%2F%3E%0A%3Cpath%20d%3D%22M113.273%2011.1276H121.752V15.2364C122.909%2012.4682%20124.78%2010.6742%20128.137%2010.8286V19.8372H127.24C123.652%2019.8372%20121.752%2021.8144%20121.752%2026.338V31.5271H113.273V11.1276Z%22%20fill%3D%22white%22%2F%3E%0A%3Cpath%20d%3D%22M127.876%2025.7402V25.663C127.876%2021.5928%20130.905%2019.3069%20135.65%2019.3069C137.367%2019.3069%20139.576%2019.683%20140.473%2020.0495V19.712C140.473%2017.8408%20139.315%2016.7605%20136.701%2016.7605C134.608%2016.7605%20132.853%2017.2042%20131.059%2017.918L129.564%2012.2755C131.917%2011.3785%20134.608%2010.7805%20138.158%2010.7805C142.305%2010.7805%20144.996%2011.6389%20146.79%2013.4329C148.324%2014.9665%20148.922%2016.9438%20148.922%2019.8952V31.5177H140.444V29.4632C139.026%2030.9968%20137.116%2031.9999%20134.579%2031.9999C130.654%2031.9999%20127.895%2029.7622%20127.895%2025.7209L127.876%2025.7402ZM140.54%2023.9848V23.1264C140.058%2022.9431%20139.306%2022.7888%20138.601%2022.7888C136.923%2022.7888%20135.988%2023.7919%20135.988%2025.065V25.1422C135.988%2026.3382%20136.846%2027.1195%20137.926%2027.1195C139.421%2027.1195%20140.54%2025.9235%20140.54%2023.9751V23.9848Z%22%20fill%3D%22white%22%2F%3E%0A%3Cpath%20d%3D%22M152.876%2017.6672H150.484V11.1278H152.876C152.915%208.95763%20153.436%207.2022%20154.709%205.93868C156.088%204.55942%20157.882%204%20160.689%204C163.197%204%20164.721%204.22184%20165.888%204.55942V9.86427C165.068%209.68101%20164.238%209.56527%20163.158%209.56527C161.846%209.56527%20161.181%2010.0861%20161.181%2011.205V11.3496H165.888V17.6672H161.364V31.5274H152.886V17.6672H152.876Z%22%20fill%3D%22white%22%2F%3E%0A%3Cpath%20d%3D%22M168.791%2024.6891V17.6674H166.399V11.1279H168.791V6.00635H177.27V11.1279H181.976V17.6674H177.27V22.8276C177.27%2024.3611%20177.983%2024.9206%20179.324%2024.9206C180.105%2024.9206%20181.002%2024.6987%20181.899%2024.284V30.8234C180.559%2031.5372%20178.533%2031.9808%20176.479%2031.9808C171.473%2031.9808%20168.782%2029.666%20168.782%2024.6987L168.791%2024.6891Z%22%20fill%3D%22white%22%2F%3E%0A%3Cpath%20fill-rule%3D%22evenodd%22%20clip-rule%3D%22evenodd%22%20d%3D%22M191.368%204.36764C197.191%20-1.45588%20206.632%20-1.45588%20212.456%204.36764C218.279%2010.1912%20218.279%2019.6324%20212.456%2025.4559L201.912%2036L191.368%2025.4559C185.544%2019.6324%20185.544%2010.1912%20191.368%204.36764ZM194.009%207.55761C193.948%207.86849%20193.916%208.39718%20193.916%209.14566V10.4189C193.916%2011.1832%20193.948%2011.7198%20194.013%2012.0267C194.078%2012.3317%20194.278%2012.6168%20194.617%2012.8762C194.956%2013.1376%20195.403%2013.3316%20195.958%2013.4623C196.512%2013.593%20197.1%2013.6583%20197.837%2013.6583C198.573%2013.6583%20199.217%2013.591%20199.769%2013.4524C200.322%2013.3158%20200.761%2013.1178%20201.086%2012.8604C201.411%2012.6029%20201.605%2012.3178%20201.666%2012.0069C201.728%2011.6961%20201.759%2011.1674%20201.759%2010.4189V9.14566C201.759%208.38134%20201.728%207.84473%20201.662%207.53781C201.597%207.23287%20201.397%206.94972%20201.058%206.68834C200.72%206.42696%20200.272%206.23291%20199.718%206.10223C199.163%205.97154%20198.536%205.90619%20197.839%205.90619C197.102%205.90619%20196.459%205.97352%20195.906%206.11213C195.352%206.24875%20194.914%206.44677%20194.589%206.70418C194.265%206.9616%20194.071%207.24673%20194.009%207.55761ZM199.276%2024.8638C202.876%2024.8638%20204.557%2024.2064%20204.557%2021.862V21.858V21.3155C204.557%2019.6581%20203.516%2018.971%20200.252%2018.3136C199.278%2018.1136%20198.908%2017.9136%20198.908%2017.3136V16.9414C198.908%2016.6543%20199.177%2016.5117%20199.413%2016.5117C199.749%2016.5117%20199.918%2016.7137%20199.918%2016.9414V18.1136H204.391V17.3988C204.391%2015.4563%20203.347%2014.4266%20199.177%2014.4266C196.15%2014.4266%20193.896%2015.3414%20193.896%2017.3711V17.7433C193.896%2019.5155%20194.805%2020.3155%20198.201%2021.0303C198.28%2021.0472%20198.355%2021.063%20198.427%2021.0781C199.329%2021.2674%20199.647%2021.3341%20199.647%2021.9174V22.2897C199.647%2022.6619%20199.546%2022.8045%20199.142%2022.8045C198.67%2022.8045%20198.637%2022.5471%20198.637%2022.262V21.2897H193.894V21.7471C193.894%2024.149%20195.476%2024.8638%20199.276%2024.8638ZM205.424%2024.5569H209.925V14.7355H205.424V24.5569ZM206.955%2013.5019H209.925V6.06064H207.092V9.411L205.193%206.06064H202.359V13.5019H205.193V10.1199L206.955%2013.5019ZM198.269%2012.152C198.204%2012.2688%20198.055%2012.3262%20197.825%2012.3262L197.827%2012.3282C197.604%2012.3282%20197.459%2012.2767%20197.398%2012.1757C197.336%2012.0748%20197.305%2011.8074%20197.305%2011.3758V7.90068C197.305%207.51852%20197.352%207.28684%20197.445%207.20962C197.538%207.13239%20197.675%207.09279%20197.851%207.09279C198.059%207.09279%20198.198%207.14031%20198.265%207.23734C198.332%207.33239%20198.366%207.55416%20198.366%207.90068V11.3203C198.366%2011.7579%20198.334%2012.0352%20198.269%2012.152Z%22%20fill%3D%22white%22%2F%3E%0A%3C%2Fg%3E%0A%3Cdefs%3E%0A%3CclipPath%20id%3D%22clip0_15247_3730%22%3E%0A%3Crect%20width%3D%22217%22%20height%3D%2236%22%20fill%3D%22white%22%2F%3E%0A%3C%2FclipPath%3E%0A%3C%2Fdefs%3E%0A%3C%2Fsvg%3E%0A)
Could Median Points Per Game be Future of Fantasy Football Analysis?

The competition in fantasy football is constantly evolving, yet the industry still uses an arcane season-long grade for how players finish. You’ve heard the arguments: “So-and-so finished as the WR23 last year and I could see him finishing top-15 this year.” The baby step forward has been the push for Average Points Per Game, commonly abbreviated as PPG. Viewing a player’s “weekly” production is helpful in making weekly roster decisions for season-long leagues as well as daily fantasy games. However, there is still a better way. That way is Median Points Per Game (MPPG will work as an abbreviation). If you don’t remember your middle-school math work, don’t worry, class is about to begin!
Why Season-long finish is not helpful
A player’s point total is impacted by far too many variables to be helpful in predicting how a player will perform in the future. A cumulative number such as 150 PPR points (the typical PPR total for the RB30) doesn’t provide any insight into how that player got to that number. There is no accounting for any variance and without games played next to the point total, there is little to create context. Take for instance Nick Chubb's 2020 season. He finished with 207.7 PPR points and was RB11. He was one spot behind Kareem Hunt who earned 218.5 PPR points. The missing piece of context is that Chubb played four fewer games than Hunt.
Over 14,000 draft prospects for this year and beyond
Why Average Points Per Game is better, but still not good enough
Keeping our example from above, we can calculate Chubb’s and Hunt’s Average Points Per Game (APPG). Since Chubb played fewer games and had similar total points, his APPG (17.3) is significantly higher than Hunt’s 13.7. This is helpful because it provides an estimate for what can be the expected output for Chubb on a given week.
The problem is that this estimate is wildly inaccurate for fantasy football. One issue lies in the actual math used to calculate an average. APPG is simply the year-long (or another cumulative time frame) total points divided by the number of games played. So by using APPG, you have not untethered from the player’s season-long total.
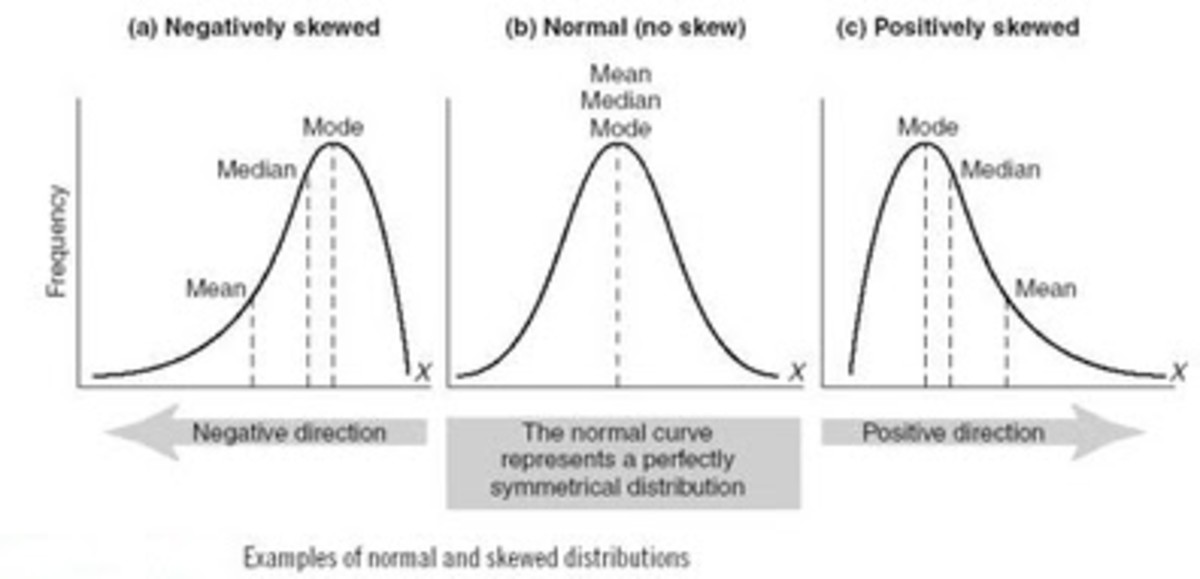
The other mathematical issue is that an average assumes a normal distribution (think bell curve from middle-school science) in order to be accurate. In a normal distribution, the average and median will be the same since there is equal “weight” on both sides of the average and median. However, when the data is non-normal, or “skewed” in one direction, the average and median will have different values depending on the direction and magnitude of the skew.
To further prove the flaws of using average in vastly non-normal data sets, statisticians and middle-school math teachers tell a “joke.” A guy and four of his best friends are at the bar. They all make around the same amount in yearly income with an average of $50,000 a year. For some unknown reason, Bill Gates, who earned over $7 billion in 2019 walks through the door. Happy day! The guy and his friends all just became billionaires . . . on average. This is a bad joke even by dad-joke standards, but it is an attempt to explore the impact of introducing a data point that transforms a normal curve to a non-normal curve.
CLICK HERE to go ALL ACCESS
Why Median Points Per Game is better
As shown in the image above, the median is closer to the “hump” in each case and the average (mean) remains relatively unchanged. Even in the bad joke above, the median income would remain much more reflective of the income of the guy and his friends as opposed to the average income which was the punchline of the joke. When we look at these images above, it should be clear that the median is a closer estimation of where the majority of values fall within a data set. To prove this point, the following image is a histogram of Tyler Lockett’s PPR points for each week of the 2020 season. Lockett’s histogram is similar to the third distribution in the image above. As the third distribution details, the mean is greater than the median despite the majority of values being on the lower end.
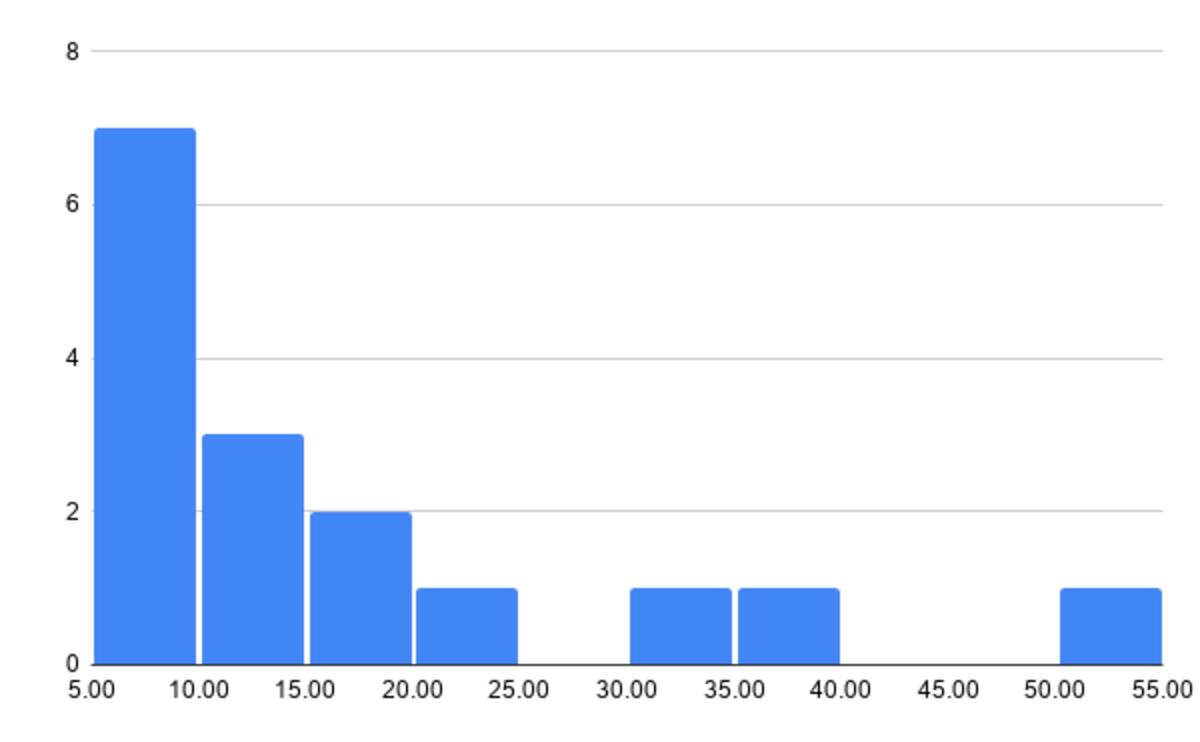
Over the course of the full 2020 season, Lockett’s APPG was 16.8 despite having only six games that were above this number. That is an astonishingly low 37.5% of games above his average points per game. Lockett’s MPPG was 10.9 and, by definition, half of his games (eight) were above this number. Lockett’s 53-point game was more than likely a game-winner. However, if you knew that 50% of a player’s games would produce 10.9 or fewer PPR points per game, how interested would you be in having that player on your fantasy roster? For reference, 10.9 PPR points was at best the WR33, at worst the WR46 (twice), and would have been WR36 or worse 16 out of 17 weeks during the 2020 season. Lockett’s 16.6 APPG ranks 12th for 2020, yet he did not produce weekly scoring that would make fantasy owners happy outside of three really big weeks. Lockett’s MPPG for the typical fantasy season (Weeks 1 through 16) was 10.2 and was tied for 48th; his APPG was 17th at 14.4.
While Lockett is an extreme example of APPG overvaluing a player, you can use MPPG to find players that are being undervalued by APPG. Any time a player’s median is greater than their average, they are scoring more points on a more consistent basis. Brandon Aiyuk is a prime example. Although Aiyuk played only 12 games, he outscored his average in seven of these games; just under 60% of the time. His average points per game from Week 1 through Week 16 was 15.4, barely outside the typical weekly WR2 range. Yet, his MMPG for this time period was 18.6, over three points higher, and puts him squarely in the middle of the WR2 range. Comparing the weeks in which Lockett and Aiyuk both played, Aiyuk scored more points than Lockett six of the 11 times even though his APPG was almost a point and a half less.
Median points per game is the next step in the evolution of understanding football data. It breaks from the context-less end-of-year totals completely in a way that APPG simply cannot. Furthermore, it more accurately reflects the brunt of a player’s scores leading to more accurate predictions.
For more on median points per game, be sure to follow me on Twitter as I will be working all offseason to spread the word as much as possible.