Myth Buster: Unpacking Seven False Ideas About MLB
Most oral traditions in baseball are wonderful heirlooms passed through generations. Move the runner to third with fewer than two outs. Don’t talk to the pitcher when he has a no-hitter. Play no-doubles depth in the outfield when the tying run is in the batter’s box. Turn your cap inside out to spark a rally. The list is a long one and adds to the charm of the game.
But in this age of technology and information, baseball changes faster than ever. Catchers catch on one knee. Fielders field one-handed. Pitchers throw fastballs less than half the time. The No. 2 hitter is a slugger, not a table setter. Pitching and hitting coaches never played in the majors.
The game changes quickly because of information, not folklore. Sacrifice hits and intentional walks are at all-time lows not because managers decided willy-nilly they didn’t like small ball, but because the data handed to them does not support (in most cases) giving up outs and handing out free base runners.
One of the worst defenses of decision-making in any business is, “Because that’s the way it’s always been done.” And that’s where the oral tradition of baseball rightfully gets blown to bits by the data.
Omar Moreno was a bad offensive player who didn’t get on base much and did not hit lefties. But he made 65% of his starts as a leadoff hitter. Why? Because he was fast and slapped the ball. He fit the tradition of what a leadoff hitter looked like, and so the Pirates kept giving a guy with a career OPS+ of 79 more plate appearances than anybody else. Would not happen today.
Joe DiMaggio made 80% of his career starts as the Yankees’ cleanup hitter, because hitting cleanup had a certain cachet. Now we know each spot down the lineup costs a hitter about 18 plate appearances a season. Mike Trout has never started a game batting fourth.

Walking a guy to set up a double play may have made some sense when strikeouts and fly balls were not so plentiful. But it’s more foolish in a game with a record number of strikeouts and few ground ball pitchers and ground ball hitters. Grounded into double plays are at a record-low rate since the DH was introduced in 1973. It’s also why you see so few hit-and-run plays.
Most people don’t like change, especially baseball people. That is why oral traditions often outlast their usefulness. I cringe when I hear tropes repeated that don’t apply to the game today, especially when we have the information readily available.
Here are seven myths that simply are not true but continue to exist simply because of the power (and inertness) of oral tradition. Be it at a bar, a broadcast, a backyard or a ballpark, the next time you hear them, just shake your head and remember the earth is not flat.
Myth No. 1: Lefties like the ball down and in
I have no idea where this trope began, but it has survived way longer than it should.
Ask yourself: Why would hitting from one side of the plate make any difference where a hitter likes the ball pitched? It doesn’t. It’s folklore. It’s just not true.
In fact, the data tells us righties actually hit the ball down and in better than lefties. They have hit 20 points higher than lefties on down-and-in pitches over the past four seasons, including 26 points higher this year.
Batting on Pitches Down and In
Lefties | Righties | |
|---|---|---|
Average | Average | |
2020 | .271 | .297 |
2019 | .268 | .299 |
2018 | .258 | .258 |
2017 | .265 | .288 |
Totals | .264 | .284 |
Overall | .251 | .252 |
Myth No. 2: Never throw a changeup on the first pitch
The theory goes like this: You’re not changing up from another pitch, so why throw it? Well, if the hitter sits on first-pitch fastballs the changeup is a good pitch. Manny Machado, for instance, is 0-for-6 on first-pitch changeups this year (five ground balls and a pop-up) and 2-for-19 over the past two seasons.
And some pitchers throw the changeup so well it doesn’t always need the camouflage of another pitch. Dallas Keuchel (43 pitches), Devin Williams (35) and Shane Bieber (33) have not allowed a hit on a first-pitch changeup this year. Last year Chris Sale threw 163 first-pitch changeups and yielded five hits.
The truth: Batters hit worse against first-pitch changeups than they do otherwise on first pitches.
Batting Average on First Pitch by Pitch Types
Changeups | All Other Pitches | |
|---|---|---|
2020 | .334 | .342 |
2019 | .321 | .356 |
2018 | .312 | .341 |
Totals | .319 | .348 |
Myth No. 3: Keep your fastball down
That became a bromide when velocity was lower and before the sinker fell out of fashion. (The pitch gets hammered because it more closely matches the plane of the modern swing than any other pitch.) It’s definitely not true in today’s game.
Batters hit 56 points higher against low fastballs than they do against high fastballs. The low fastball is a worse pitch for elite throwers such as Max Scherzer (+.262 points), Gerrit Cole (+.236) and Jacob deGrom (+.107).
Teams such as the Rays use the data for a general pitching philosophy: get ahead with high fastballs, then finish off the hitter with your best breaking ball down.
Batting vs. Fastball by Height, 2018–20
Avg. | SLG | |
|---|---|---|
High Fastballs (3 feet or higher) | .195 | .367 |
Low Fastballs (2 feet or lower) | .251 | .377 |
Myth No. 4: You have to put the ball in play to win in the postseason
It helps to avoid strikeouts on offense, but it’s not as important as you may have been led to believe. Of the past eight pennant winners, half of them did not rank in the top four in their league in fewest strikeouts.
What is much more important is getting strikeouts from your pitching staff. All eight of those past eight pennant winners ranked in the top four in their league in strikeouts by pitching staffs. That’s good news for teams such as the Padres (tied for fourth in strikeout rate) and Twins (third), who haven’t won a pennant in at least 22 years.
League Rank in Strikeouts by Pennant Winners, 2016–19
Batters (Fewest) | Pitchers (Most) | |
|---|---|---|
2019 Astros | 1 | 1 |
2019 Nationals | 2 | 4 |
2018 Dodgers | 10 | 1 |
2018 Red Sox | 4 | 3 |
2017 Astros | 1 | 2 |
2017 Dodgers | 9 | 1 |
2016 Indians | 7 | 1 |
2016 Cubs | 11 | 3 |
Myth No. 5: Velocity is changing the game
Use the past tense: changed the game.
Velocity plateaued years ago, but people keep talking as if it’s going up. Now breaking pitches, especially the slider, are changing the game.
Fastball use has declined five consecutive seasons and now for the first time do not account for the majority of pitches. Velocity has stagnated and use has gone down. Hitting is harder because of spin, not speed.
MLB Fastball Metrics
4-Seam MPH | Fastball Pct. | Batting Average | |
|---|---|---|---|
2015 | 93.1 | 56.8% | .277 |
2016 | 93.2 | 56.3% | .280 |
2017 | 93.2 | 55.3% | .279 |
2018 | 93.1 | 54.5% | .270 |
2019 | 93.4 | 51.9% | .276 |
2020 | 93.3 | 50.0% | .269 |
Myth No. 6: The first inning is the highest-scoring inning
This used to make total sense. Whenever you hear someone talk about a pitcher’s high ERA in the first inning you should remember two things: 1) it’s such a small sample size one rough first inning can blow it up, and 2) the first inning is the only inning when a manager can optimize his run production by choosing the order of hitters.
Greg Maddux’s worst inning? The first (4.09). Tom Seaver? First (3.75). Bob Gibson? Pedro Martinez? Sandy Koufax? First, first, first (4.00, 3.63, 3.35).

The first inning always is the highest scoring inning—until now. In this weird season something really weird is going on. The first inning has the fifth-lowest ERA. Now the worst inning for pitchers is the third. The middle innings (3, 4, 5, 6) all have a higher ERA than the first. Go figure.
For the first time in history, OPS allowed in the first inning is almost average. (It’s usually well above average.)
This is your opportunity to come up with your own theory to explain why teams this year have solved the run prevention problem of the first inning. Lack of adrenaline with no fans in the stands? More scripted pitch sequences based on more detailed scouting reports? More relaxed pre-game bullpens with no fans? Climate change? Whatever. It is strange but true.
First Inning ERA, 2011–20
ERA | Rank Among Inn., 1-9 | |
|---|---|---|
2020 | 4.45 | 5 |
2019 | 4.85 | 9 |
2018 | 4.58 | 9 |
2017 | 5.02 | 9 |
2016 | 4.73 | 9 |
2015 | 4.59 | 9 |
2014 | 4.21 | 9 |
2013 | 4.19 | 9 |
2012 | 4.67 | 9 |
2011 | 4.54 | 9 |
Myth No. 7: Home-field advantage in the postseason is overrated
There is some recency bias associated with this myth, seeing that the home team lost all seven World Series games last year. But don’t be fooled by that small sample.
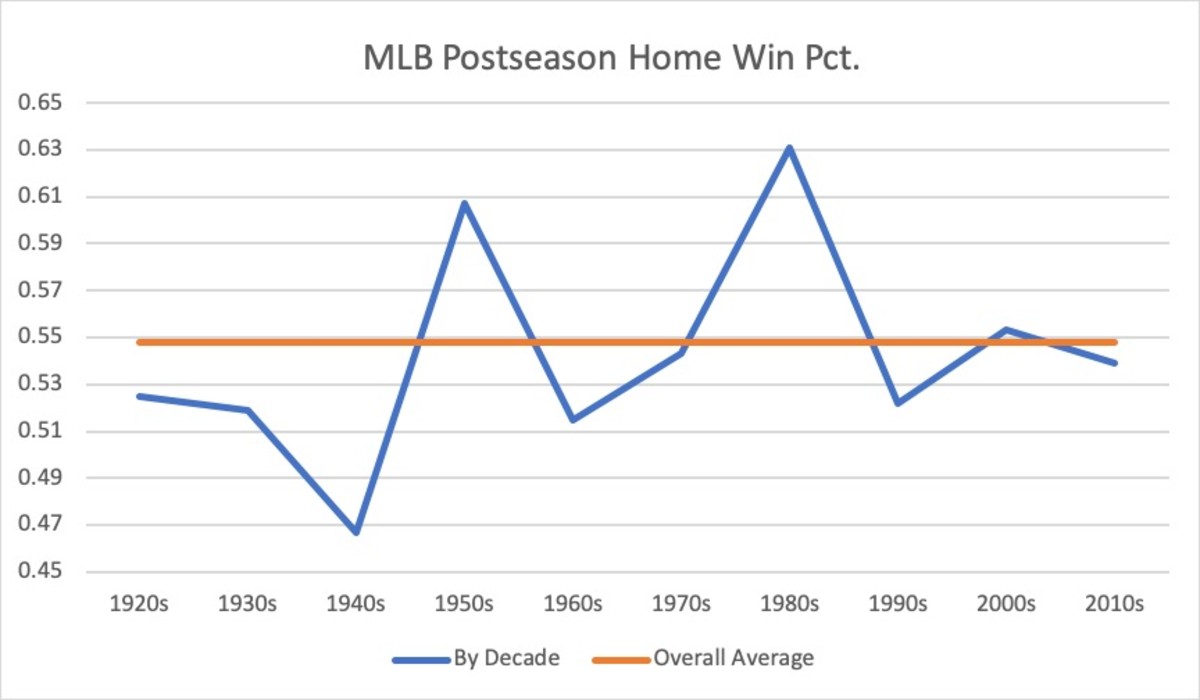
Home field in the postseason from 2010-19 returned a win percentage of .539—that’s better than the regular-season rate during the decade, .535.
And as the playoffs expanded and as ballparks grew louder, home-field has become a bigger advantage. It returned a win percentage of .527 in the first five decades of the live ball era (1920-69), but a .553 win percentage in the next five decades.
(For some reason, the 1980s were the glory years for the home teams. They won 63% of the time. The Dodgers, Cardinals and Twins went 35-9 at home in the postseason that decade.)

This brings us to this odd, pandemic-influenced season. First-round games will be played in the home park of the higher seed, but with no fans in the stands. Games in the Division Series, League Championship Series and World Series will be played in neutral-site “bubbles.”
That means the 54% advantage that comes with being the home team dwindles to next to nothing. (Even in a bubble, it’s still an advantage to bat last. Once a tie game enters the ninth inning, the home team never has to protect a lead.) And that means you are slightly more likely to see upsets this year.
One more wrinkle this year that will make this postseason even more unpredictable: MLB and the players association are close to an agreement on no off days in the first-round series (up to three straight games), Division Series (five straight) and League Championship Series (seven straight). The World Series would retain its usual two off days (after Games 2 and 5).
Without travel within a series, and with a premium on a condensed schedule amid the pandemic, there is no need for the usual off days. Playing a series without off days places a greater emphasis on pitching depth. That’s good for the Dodgers and Rays.
Last year the Washington Nationals had 13 days off in their 30-day run to the world championship. They played three straight days only once in the month. Manager Dave Martinez was able to use Stephen Strasburg, Max Scherzer and/or Patrick Corbin in 14 of their 17 postseason games.
The condensed schedule this year will be even more challenging in handling pitchers in the postseason because teams have treated pitchers with even more care than usual.
They have continued to turn “normal rest” into five days between starts, not four. Only 40% of starts this year have been made on three or four days of rest.
Four days of rest is now “short rest.” Strange but true in a game that changes faster than ever.
