D-backs Last 30 Games: Anatomy of a Slump
At then end of play on June 27th the Diamondbacks had just defeated the then first place Tampa Bay Rays 8-4. They got most of their runs on four homers and it seemed to be a statement game that they could indeed beat good teams. That was a criticism that had been mounting in June as they ran up their record against weaker opponents but struggled against better teams. Regardless of how they did it however, their record heading into play on June 28th was 48-32 with a +40 run differential and they held a 2.5 game lead over the Dodgers in the NL West.
Since then they've gone 9-21, .300 Win %, and been outscored by 44 runs to stand 57-53 with a -4 run differential. That record is the worst in the National League over the last 30 games, and tied with the White Sox for worst in MLB. Even the Rockies at 12-18 in their last 30 have been better.
Arizona is now 6.5 games behind the Dodgers in the division, and 1.5 games out of the final wild card spot. The Cubs and Padres, both teams with large positive run differentials, are breathing down their necks as they seem to be figuring out how to win close games now. The D-backs playoff odds are down to about 25% and sinking fast.
So what happened ? During this slump both the hitting and pitching have been inconsistent and often abysmal. Base running and defensive mistakes have cropped up at all the wrong times too, and the team has appeared to lose focus. Here is a breakdown of their breakdown.
Offense
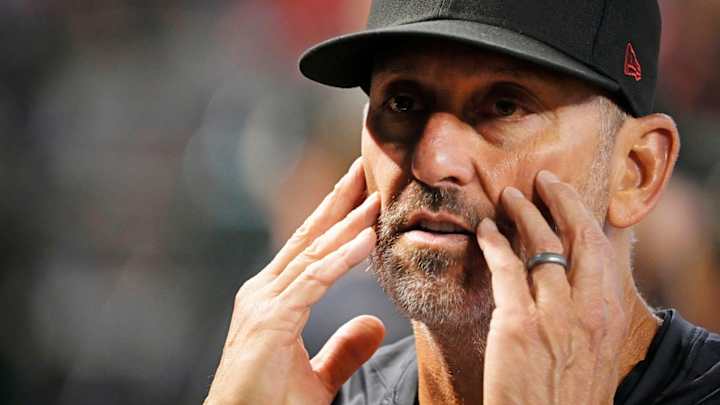
Five games into their slide, things didn't look quite right. I mentioned this during the post game interview with Torey Lovullo after they dropped the series finale to the Angels on July 2nd. They had hit just .208 in the previous five games, and scored 14 runs. After the game I asked Lovullo about a potential emerging batting slump, but he shrugged it off, unwilling to acknowledge the slippage.
"It's hard to say.....we're a team of hitters that can put up crooked numbers. We've been missing Corbin, we know that. It's time for other guys to step up. It's probably just a small sample size"
Perhaps quicker acknowledgement of the issue might have helped shorten the slump. But there may not have been much he and the coaches could have done to stave off this regression. In fact the team had been outperforming it's expected batting average and slugging by large margins up to that point in the season, and seemed primed for that regression. Their xBA (expected batting average) was .246, or 16 points lower than their actual .262 and the xSlug was .395, a whopping 39 points lower than their actual slugging of .434. Those gaps have narrowed somewhat over the last 30 games but remain quite large. (.255 BA vs. .244 xBA, .423 Slg, vs. .389 xSlg).
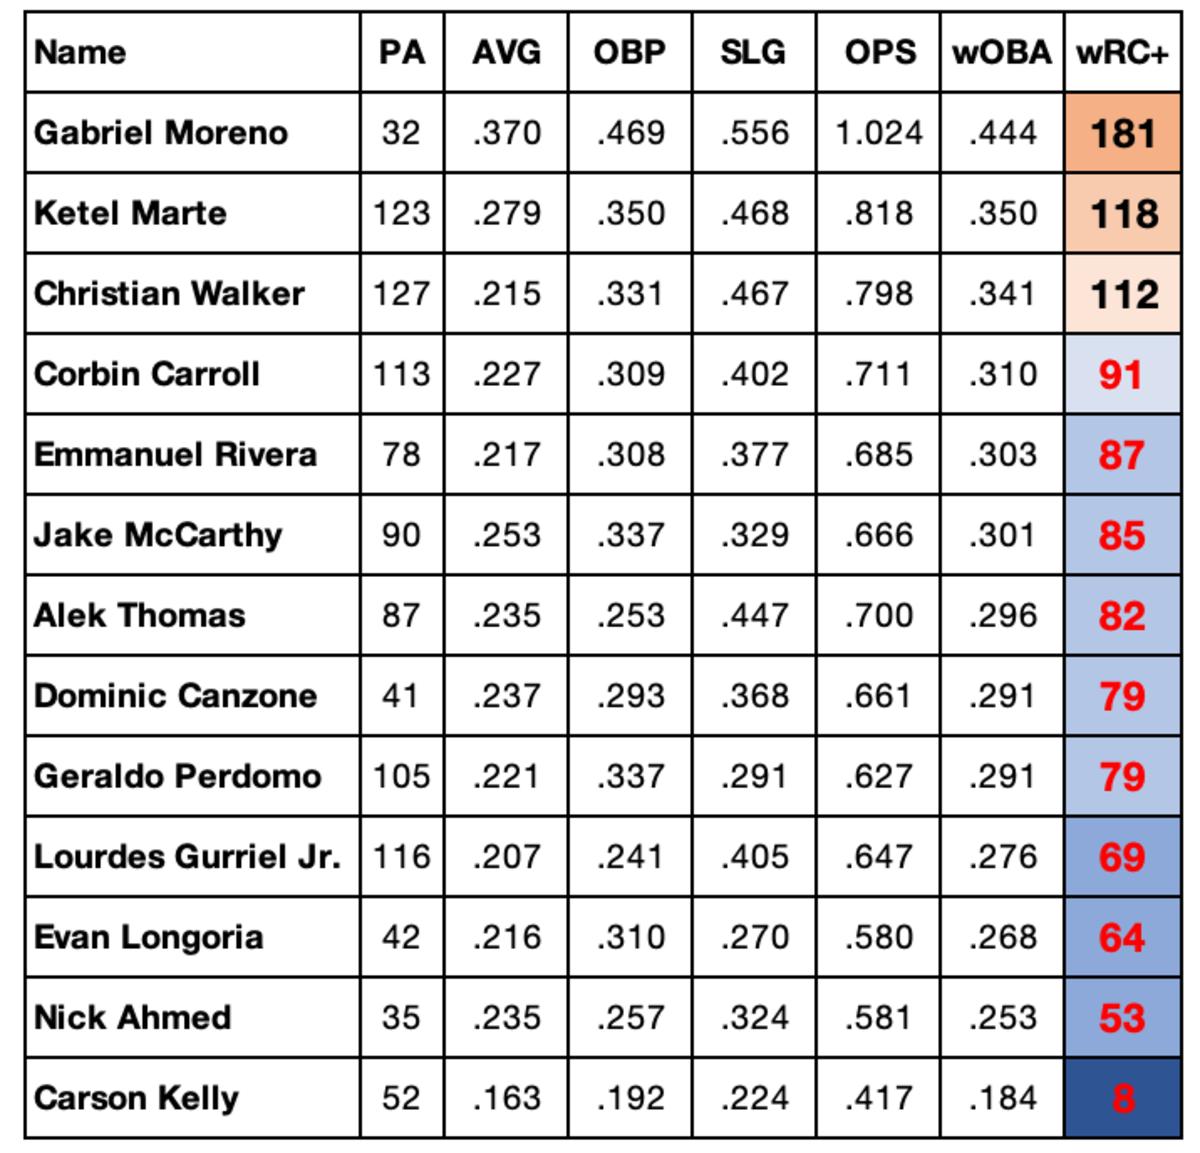
The table below shows just how far the offense has fallen relative to the league over their last 30 games, ranking in the bottom three or four teams in most categories. It's also notable that their 3.6 runs per game is inflated by a singular 16 run outburst in Atlanta. They are averaging 3.2 runs per game in the other 29 contests in this stretch.

There are only two full time players on the team that have put up above average production greater than 100 wRC+ over the last 30 games, Ketel Marte and Christian Walker. (Over 100 is roughly percent better than average, under 100 is the percent of the average. Higher good, lower bad ) In Walker's case it's been all or nothing, as he has just 23 hits and is batting .215, but he does have six homers and nine doubles to go with his 32 strikeouts. Every other hitter on the team has been below average.
Pitching
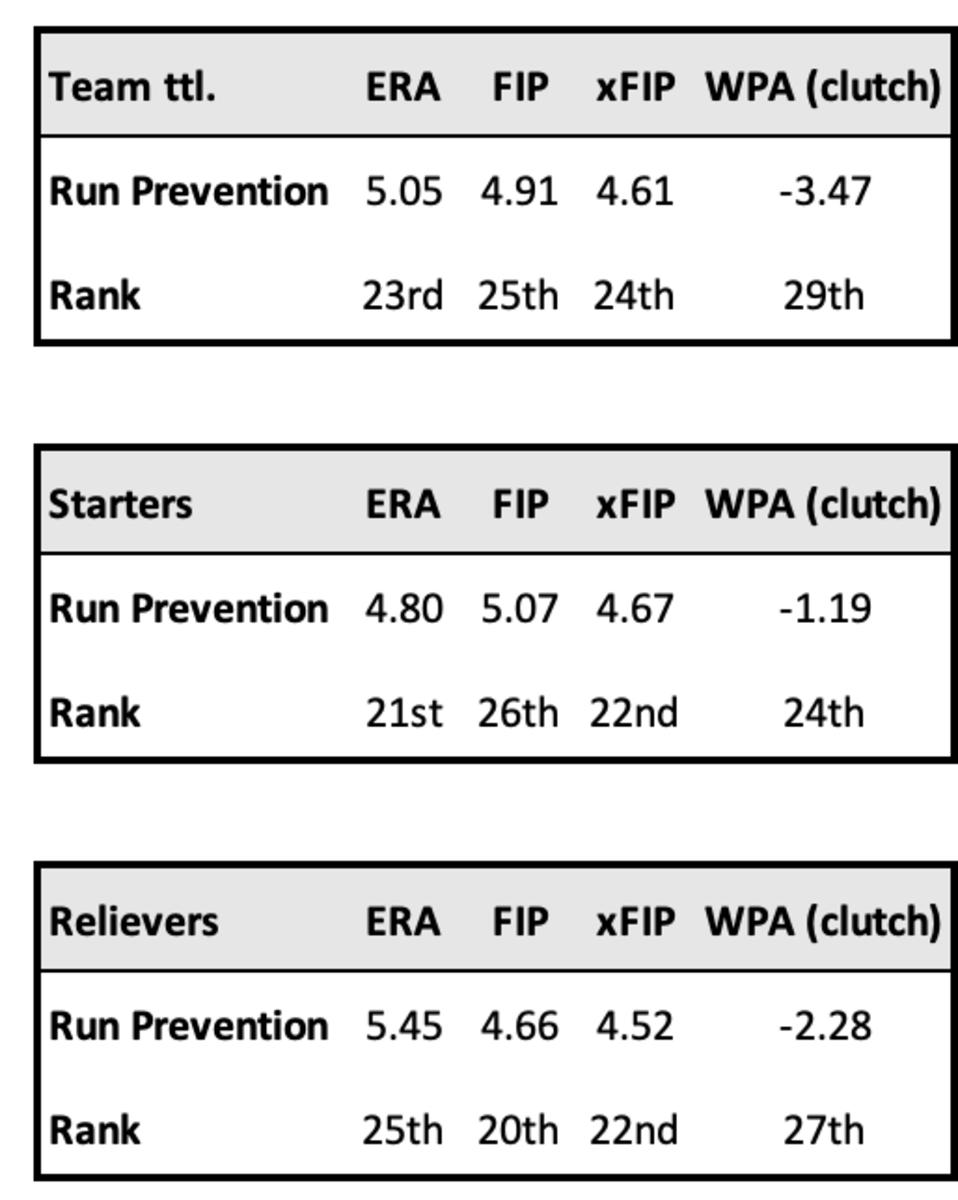
Outside of a hot start by Zac Gallen and Merrill Kelly, the Diamondbacks pitching in total had not been a team strength all year. While not quite as bad as the offense, over the last 30 games the D-backs pitching staff continues to rank in the bottom third in most pitching metrics. This has been especially true when it's mattered most, as evidenced by WPA , or win percentage added. The bullpen's late inning meltdowns and blown leads are reflected in the large negative number and poor ranking in WPA. But the rotation has also blown a number of leads too. FIP and xFIP are fielding independent metrics that sometimes show a large divergence between actual results and deserved results. For the team overall those are more or less in line with results, although there has been some bad luck for the bullpen
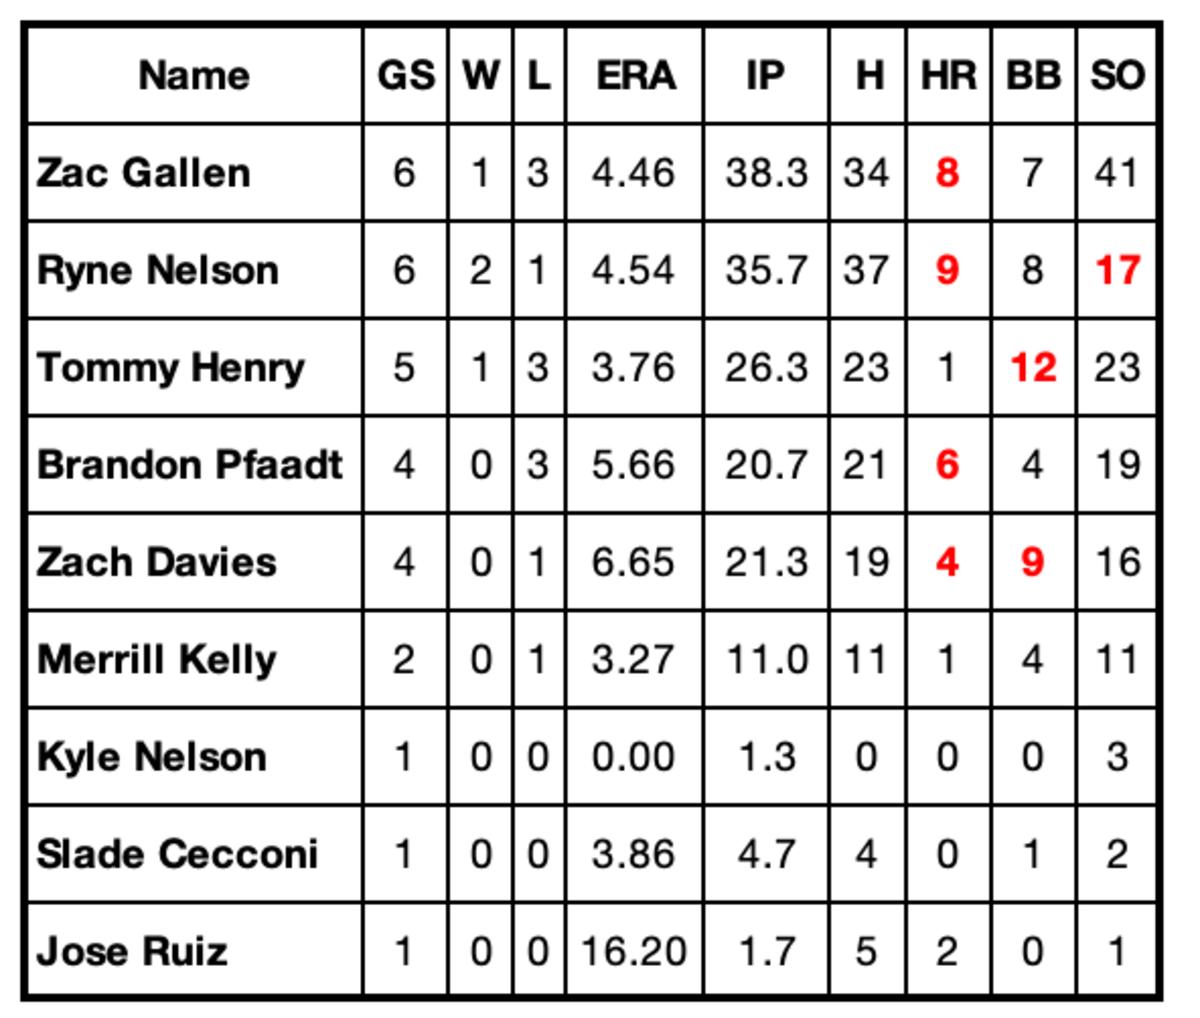
Among the starting pitchers, the issue for Zac Gallen has been the home runs. He simply has become homer prone over his last 11 starts, predating even the 30 game stretch we are reviewing here. For Nelson the lack of strikeouts results in too many hits and homers leading to inconsistent results, especially at home. Zach Davies (back) and Tommy Henry (elbow) are on the injured list. Davies was pitching very poorly when he did post up. Slade Cecconi and Brandon Pfaadt had encouraging outings against the Giants this week, offering a glimmer of hope.
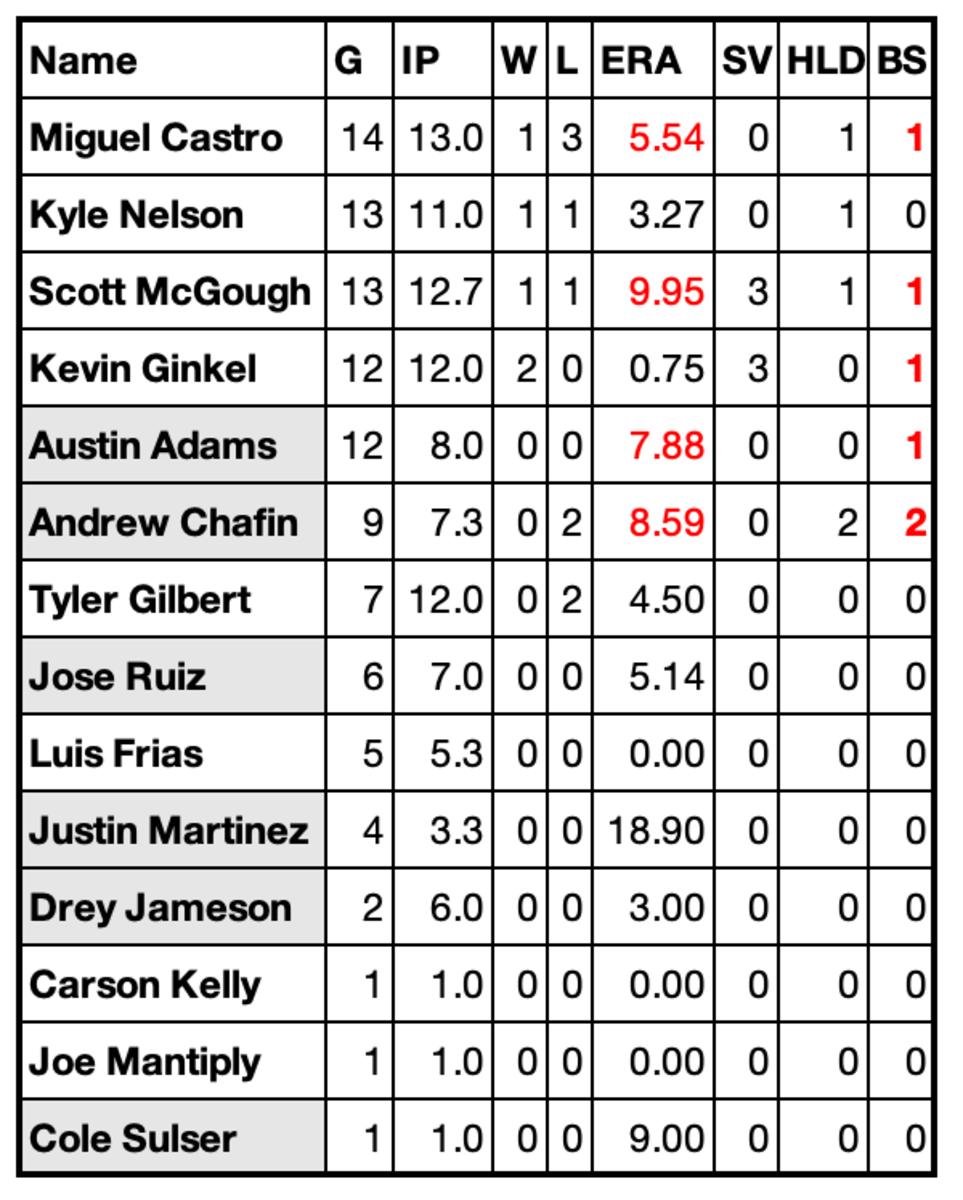
The bullpen collapse has resulted in a lot of turnover. Andrew Chafin was traded, Jose Ruiz and recently Cole Sulser were DFA'd. Drey Jameson is out for the year with a UCL sprain. Justin Martinez was optioned back to Reno after a couple of very poor outings. And just the other day Austin Adams suffered a fractured ankle on a comebacker and is out for the year.
Kevin Ginkel has been the best reliever over the last 30 games, and Kyle Nelson has been decent. But veterans Chafin, Castro, and McGough failed repeatedly late in games and took turns blowing the precious few ninth inning leads the team had. The D-backs traded for a bonafide closer in Paul Sewald this past Tuesday, but he has yet to pitch in a game.
Summary
Whether or not Torey Lovullo and the coaching staff can find a way to guide the players back to contention remains to be seen. It appears the odds are stacked against them, due in large part to a schedule that is still quite difficult. 24 of their next 27 games are against teams either currently in a playoff spot, or contending for one. The only exception is three games against the Rockies, but those are in Colorado.
Mike Hazen said before the season started that his goals were to first be a buyer at the trade deadline and then to be playing meaningful games in September. He was quite frank in admitting that the team's performance over the last month turned him from an aggressive buyer to a tepid one. Although he picked up Sewald and platoon players Tommy Pham and Jace Peterson, Hazen failed to make a trade for a starting pitcher. He cited inflated costs and roster construction issues, but the fact is his team has been falling apart, and he sees that, lessening the sense to be any more aggressive. Perhaps they can turn it around again and playe better baseball. Anything is possible while you still aren't mathematically eliminated, right ?
